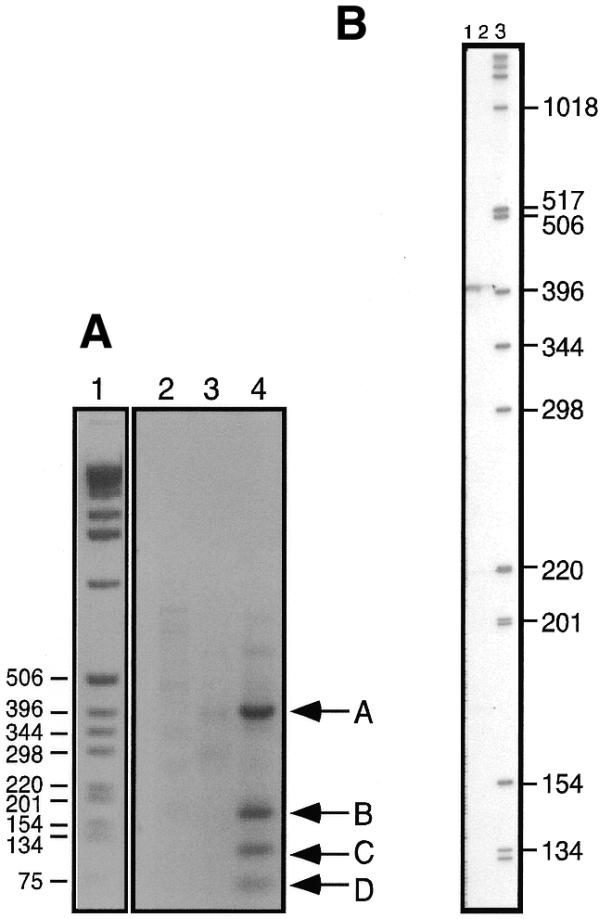
Figure 6.

RT–PCR and primer extension analysis of the RNH1 5′ splice acceptor sites. (A) Agarose gel analysis of PCR products. The molecular weight markers (lane 1) are from the same gel as the reaction products but intervening lanes have been removed. Numbers indicate molecular masses (in bp). Lanes 2–4 contain DNA synthesized by RT–PCR using oligonucleotides B24 and poly(A)+ RNA for reverse transcription followed by PCR amplification with Taq polymerase using the spliced leader oligonucleotide (lane 2), B11 oligonucleotide, (lane 3) or oligonucleotides B11 and the spliced leader oligonucleotide (lane 4). Product A corresponds to the splice acceptor site at –235 in Figure 7 (the first nucleotide in the ORF is +1); B, sites –4 and +8; C, sites +58 and +65; D, site +109. (B) Denaturing polyacrylamide gel analysis of primer extension products. Lane 1, primer extension analysis using oligonucleotide B11; lane 2, 50% of the same extension products as in lane 1; lane 3, molecular weight markers. Numbers indicate marker sizes in nucleotides.
