
Figure 1.
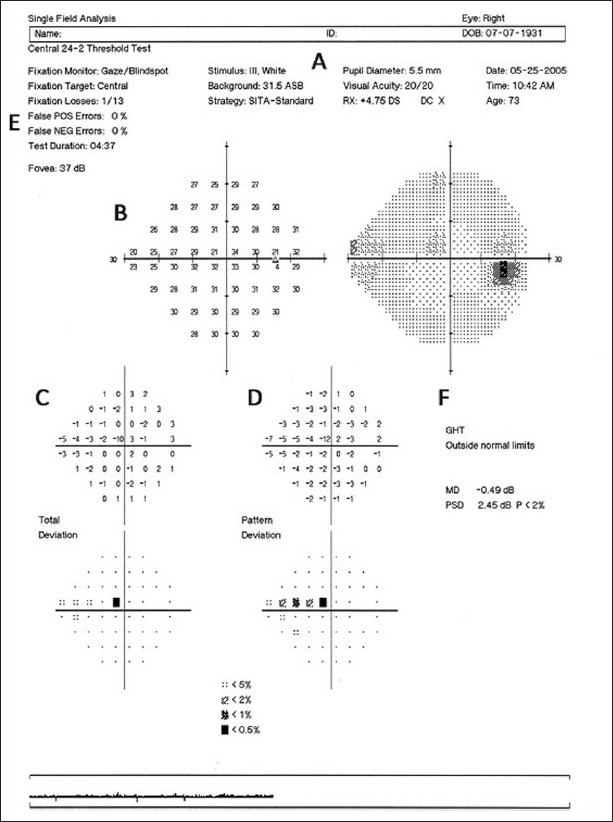
Example of the printout obtained for a white-on-white test using the SAP 24-2 SITA algorithm. (A) Identification of the patient, the stimulus used, and the test algorithm. (B) Numerical display of the threshold values and its corresponding gray scale map. (C) Total deviation values and corresponding probability plot. (D) Pattern deviation values and corresponding probability plot. (E) Reliability indices. (F) GHT and global indices