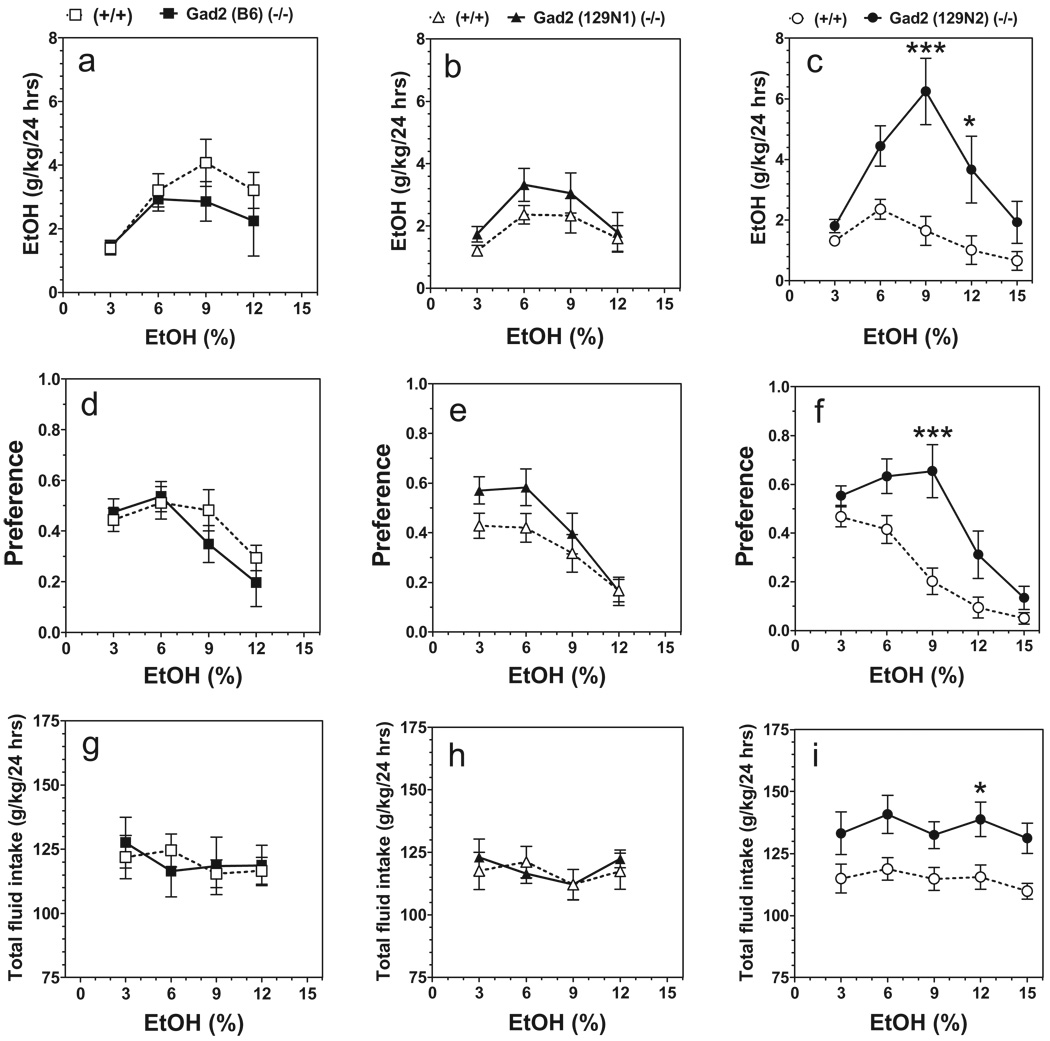
Figure 1.
Voluntary ethanol (EtOH) consumption in Gad2 (−/−) and wild-type mice on three genetic backgrounds (24 hours two-bottle choice paradigm). Data represent consumption and preference as a function of ethanol concentration. Ethanol consumption (g/kg/24 hours). (a) B6; (b) 129N1; (c) 129N2. Preference for ethanol. (d) B6; (e) 129N1; (f) 129N2.Total fluid intake (g/kg/24 hours). (g) B6; (h) 129N1; (i) 129N2 (B6: n = 8–16 per genotype. 129N1: n = 10 per genotype. 129N2: n = 10 per genotype). *P < 0.05; ***P < 0.001—significant difference relative to wild-type mice for same concentration of ethanol (Bonferroni post-test).Values represent mean ± standard error of the mean for 4 days of consumption

