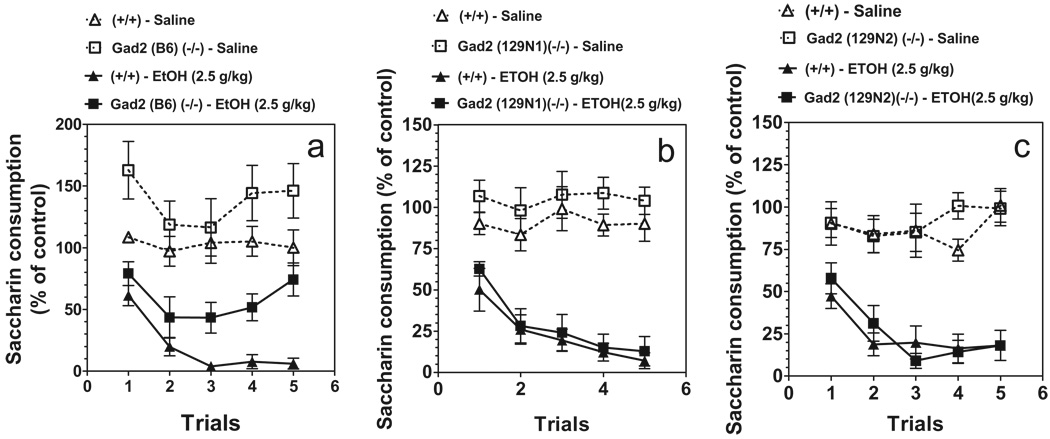
Figure 5.
Ethanol-induced conditioned taste aversion is not affected by deletion of Gad2 in mice. Data represent the changes in saccharin consumption produced by injection of saline or ethanol. (a) Mice on B6 inbred background (n = 5–7 for saline injection for all genotypes; n = 5–7 for groups with ethanol injection). (b) Mice on 129N1 background (n = 5 for saline injection for all genotypes; n = 7–10 for groups with ethanol injection). (c) Mice on 129N2 background (n = 5 for saline injection for all genotypes; n = 9–10 for groups with ethanol injection).Values represent mean ± standard error of the mean

