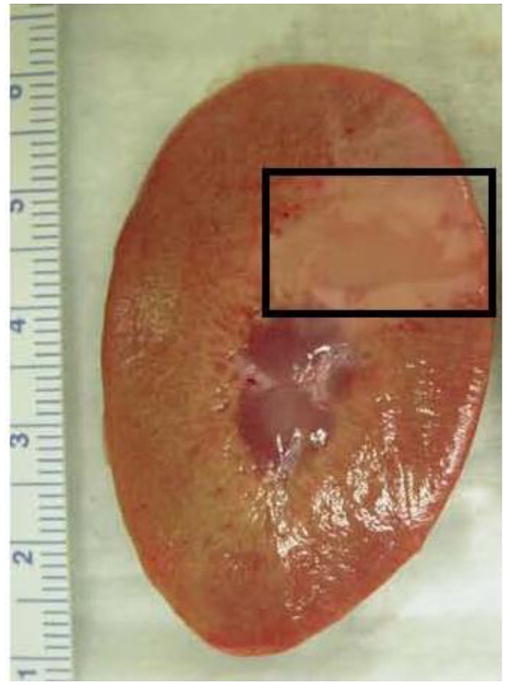
Figure 2.

Cross section of the kidney cortex. Boxed area indicates the region where histotripsy was applied: this was determined by measuring the region’s proximity to the edge of the kidney and comparing its distance to that measured when viewed with ultrasound imaging.
