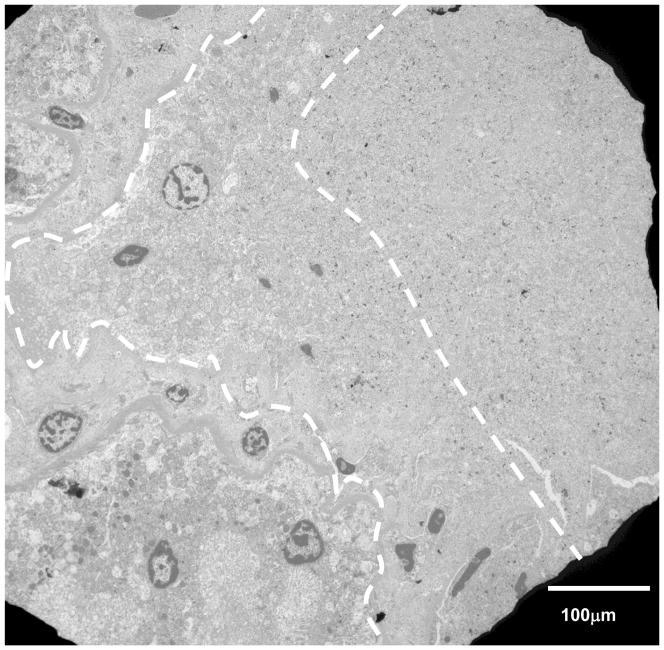
Figure 7.
TEM micrograph of the kidney cortex at 1450X magnification. The dashed white lines represent the approximate boundary between the treated and untreated regions and a transition in the morphology of the subcellular material is clearly evident: there is a clear absence of membranes and other subcellular features. Nuclei appear pyknotic and there is less presence of mitochondria (the two more robust organelles). To the right of the region, there are less recognizable subcellular features; to the left, the cellular material is more clearly defined.

