Figure 9.
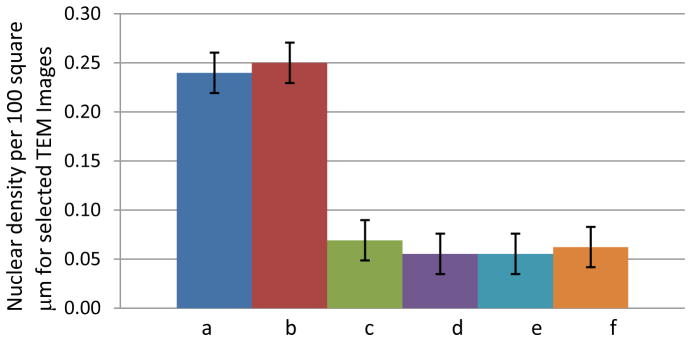
Figure 9A. Comparing nuclear densities per 100 μm2 between the untreated control kidneys (a-b) and treated areas adjacent to the homogenate border (c–f); n = 4 for each organelle.
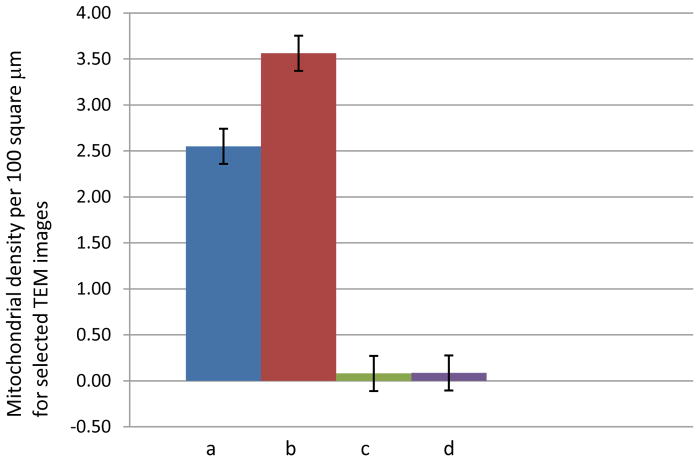
Figure 9B. Comparing mitochondrial densities per 100 μm2 between the untreated control kidneys (a–b) and treated areas adjacent to the homogenate border (c–d); n = 4 for each organelle.
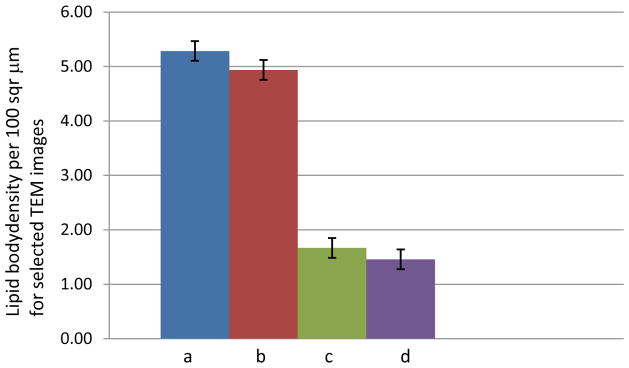
Figure 9C. Comparing lipid body densities per 100 μm2 between the untreated control kidneys (a–b) and treated areas adjacent to the homogenate border (c–d); n = 4 for each organelle.


