Table 1.
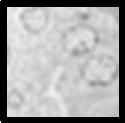
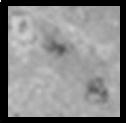
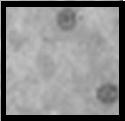
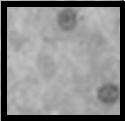
Classification of homogenate morphology (“Histotripsy Scale”) with gradation describing the composition of the cells and sub-cellular structures in different stages of fractionation. The scale ranges from 0 (minimal disruption; indistinguishable from untreated tissues) to 5 (total homogenization of cells and tissues). Representative TEM images below each classification number exemplifies that particular classification
| Class 0: Cells in the treated zone indistinguishable from normal untreated cells. |
 |
| Class 1: Areas in each slide showing minimal damage to organelles sensitive to mechanical disruption, eg: endoplasmic reticulum, plasma membrane, mixed with significant areas with no discernible damage. |
 |
| Class 2: All areas of slide exhibiting some damage, particularly the cell membrane. |
 |
| Class 3: Severe damage to sensitive organelles, with some damage to most nuclei. Nuclei becoming pyknotic with tendency of having condensed chromatin. |
 |
| Class 4: Significant reduction in the number of recognizable nuclei. Very few sensitive (membrane rich) organelles left. Those that are recognizable are severely damaged. All recognizable nuclei are severely pyknotic. |
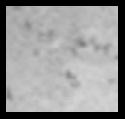 |
| Class 5: No distinguishable cells or cellular organelles even within the boundary of the treated zone on either the H&E or electron micrographs. “Complete” homogenization of the tissue. |
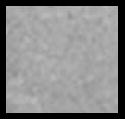 |
