Figure 1.

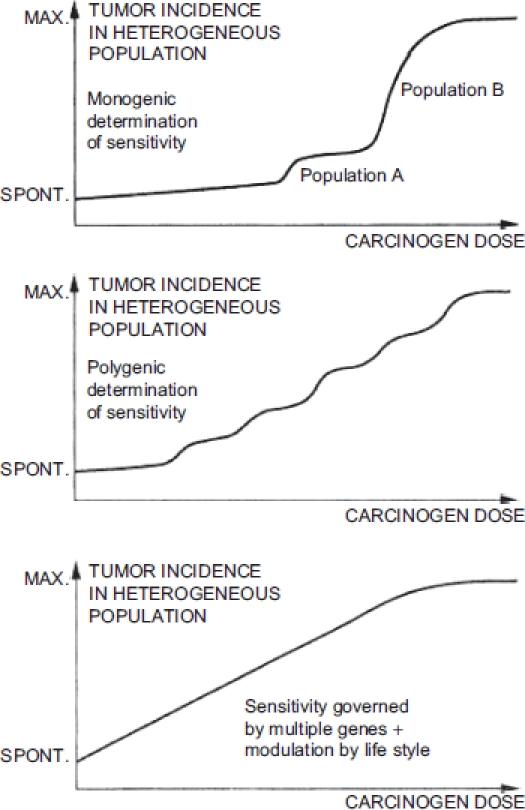
Schematic representation presented by Lutz (1990) of doseresponse relationships in heterogeneous populations, with increasing factors affecting sensitivity to a chemical carcinogen in each graph.

Schematic representation presented by Lutz (1990) of doseresponse relationships in heterogeneous populations, with increasing factors affecting sensitivity to a chemical carcinogen in each graph.