Figure 1.

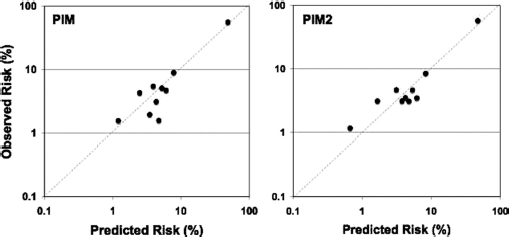
Calibration plots for PIM. The two plots show the observed risk by expected risk in deciles of expected risk using a log scale for the two versions of PIM.

Calibration plots for PIM. The two plots show the observed risk by expected risk in deciles of expected risk using a log scale for the two versions of PIM.