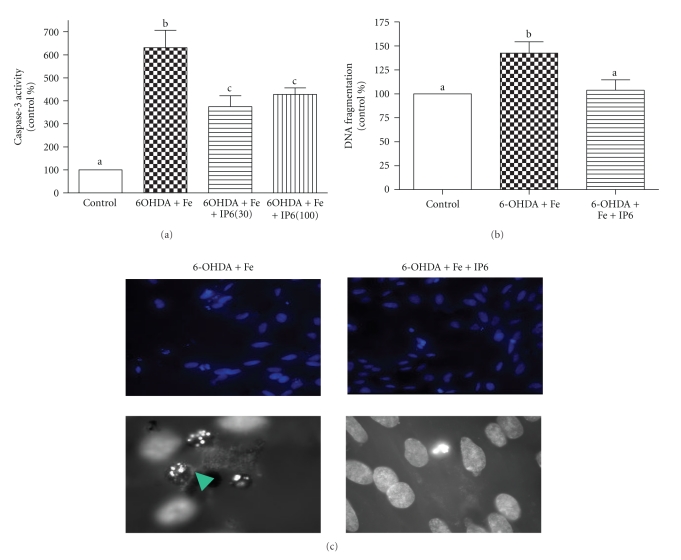
Figure 2.
Protection of IP6 against 6-OHDA-induced apoptosis in the iron-excess condition in vitro cell culture model. Cell apoptosis was measured as caspase-3 activity (FU/mg protein, (a) n = 4-5-5 from one experiment) with 30 and 100 μmol/L IP6. DNA fragmentation (AU/mg protein, (b) n = 3-4-4 from one experiment) and Hoechst nuclear staining (c) were tested with only 30 μmol/L of IP6. ANOVA with Tukey's Multiple Comparison test was used to detect the differences among the treatments in (a) and (b), and means with different letters were significantly different (P < .05). The top panel in C represents 20x magnification and the bottom panel represents 60x magnification. Apoptotic nucleus is indicated with an arrow.

