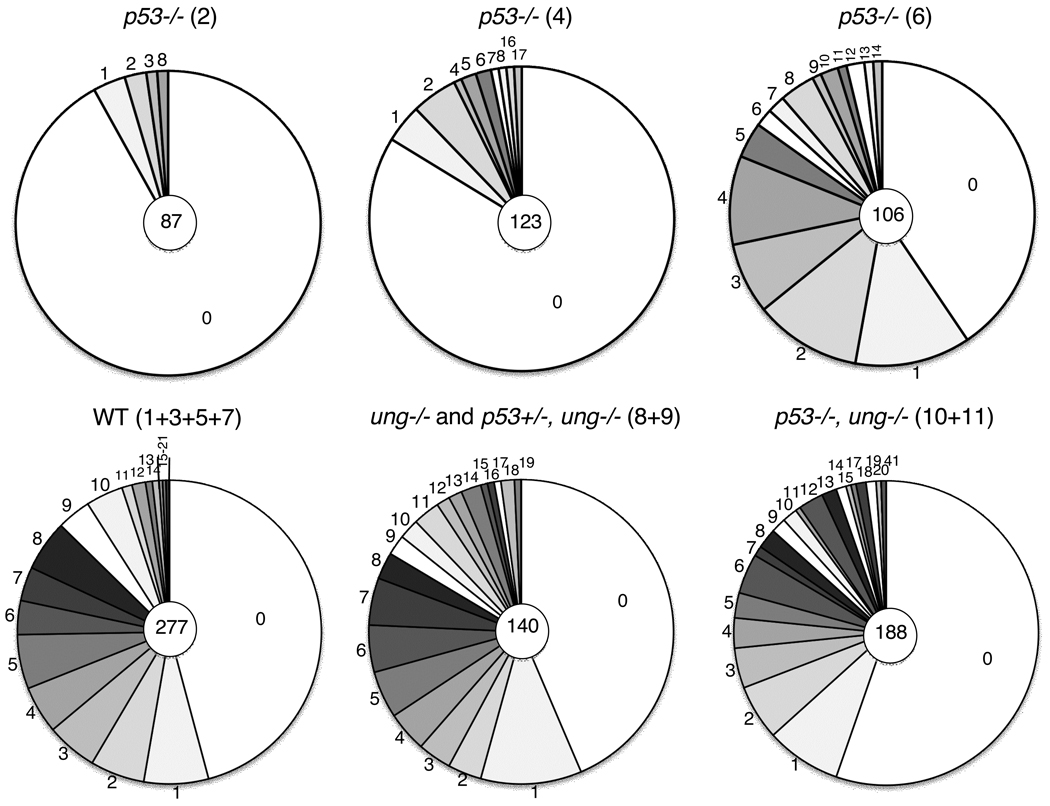
Fig.2. Mutation frequencies in wildtype and p53−/− mice.
The pie charts depict the number of point mutations per DNA clone (1.24 kb). The numbers in the central circle are the total number of clones sequenced. The numbers in parentheses ( ) refer to the mouse numbers in Table 2A.

