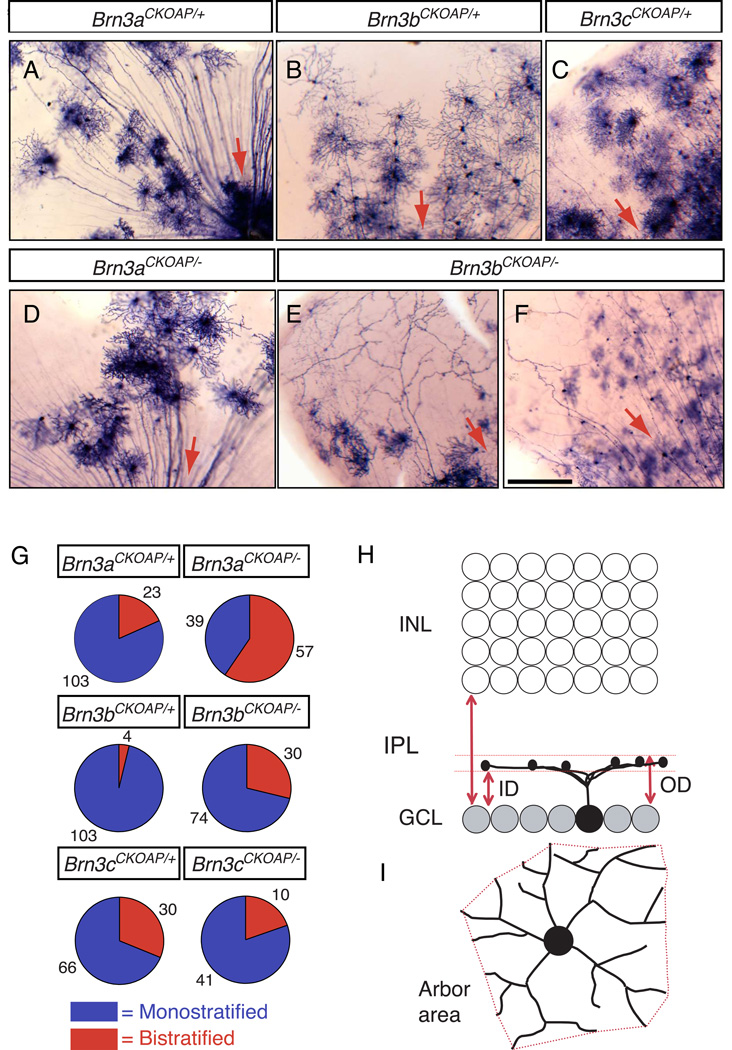
Fig. 1. Mouse RGCs visualized by sparse recombination of conditional AP reporter knock-in alleles at the Brn3a, Brn3b, and Brn3c loci.
(A–F) Flat mount preparations of retinas from (A) R26rtTACreER/+;Brn3aCKOAP/+, (B) R26rtTACreER/+;Brn3bCKOAP/+, (C) R26rtT-CreER/+;Brn3cCKOAP/+, (D) R26rtTACreER/+;Brn3aCKOAP/−, and (E,F) R26rtTACreER/+;Brn3bCKOAP/− mice, histochemically stained for AP activity. Red arrows indicate the direction of the optic disc. (G) Pie charts showing the ratios of monostratified (blue): bistratified (red) RGCs from retinas of the indicated genotypes. The number of cells of each type is indicated. (H,I), Morphological parameters for the analysis of RGC dendritic arbors. In (H), the inner distance (ID) and outer distance (OD), normalized to the IPL thickness, together define the level of arbor stratification and thickness. ID and OD equal 0 at the level of the ganglion cell layer, and they equal 1 at the level of the INL. In (I), the arbor area is calculated as the area of the polygon (in red) with the shortest perimeter that connects the tips of the RGC dendrites when projected in the plane of the retina. Scale bar in F, 100 µm.

