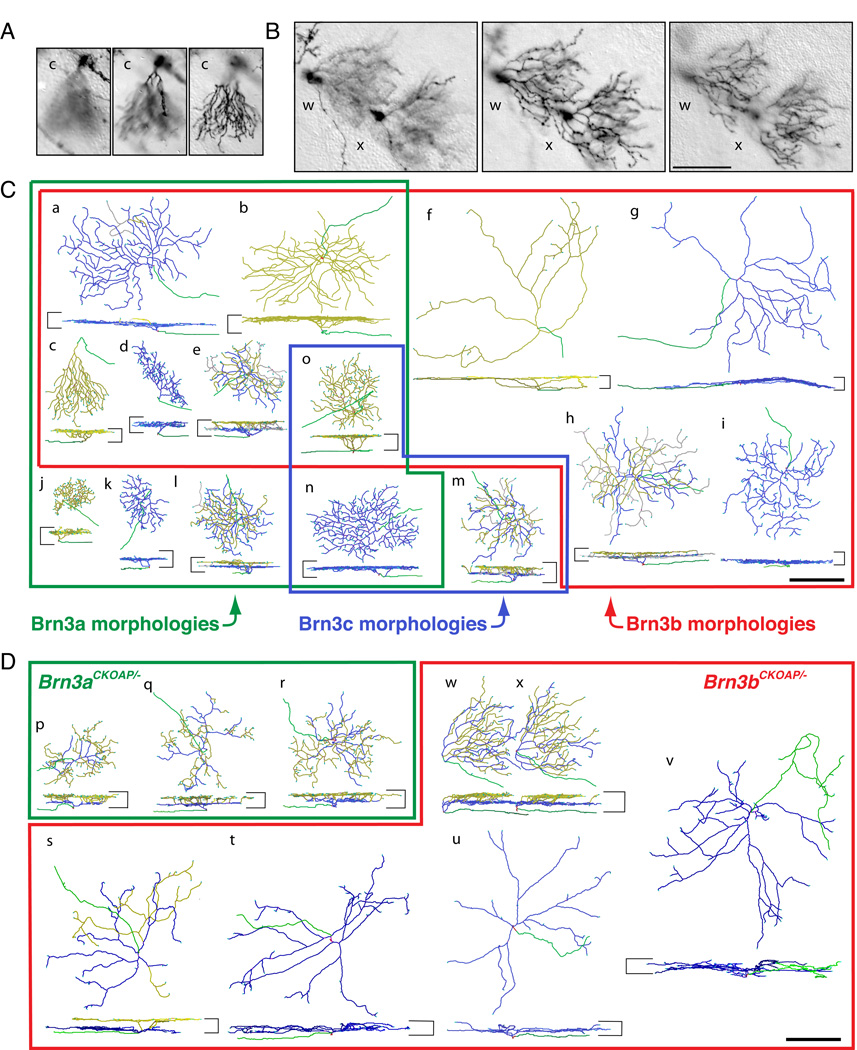
Fig. 2. Examples of the morphologies of WT and mutant RGCs expressing each of the three Brn3AP alleles.
(A,B) Sequential z-dimension DIC images of one Brn3bAP/+ (A) and two Brn3bAP/− (B) RGCs in flat mounted retinas. The planes of the optical sections are at the nerve fiber layer (left panels), at ~0.3–0.4 IPL depth (central panels) and at the boundary of the IPL and INL (right panels). The images in (A) and (B) correspond, respectively, to reconstructed cell c in panel (C) and reconstructed cells w and x in panel (D). For cell c, the dendrites stratify adjacent to the INL, whereas for cells w and x there are two distinct arbors (coded blue and yellow in (D)), one stratifying at an IPL depth of ~0.35 and the second stratifying adjacent to the INL. (C,D) Reconstructions of individual Brn3AP/+ (C) and Brn3AP/− (D) RGCs obtained from DIC z-stacks similar to the ones sampled in panels (A–B). For each cell, en face (top) and vertical views (bottom) are shown. The boundaries of the IPL are shown as horizontal bars on the sides of each vertical projection. Axons are green, vitreal (“ON”) dendrites are blue, and scleral (“OFF”) dendrites are yellow. “Recurrent” dendrites, defined as originating in the scleral plexus and ending in the vitreal plexus, are gray (present in cells a, e, h, l, and m). (C) Distinct RGC morphological types representative of the Brn3aAP/+, Brn3bAP/+ and Brn3cAP/+ data sets are enclosed in green, red and blue outlines, respectively. Types j, k, and l are unique to Brn3aAP/+ RGCs; types f, g, h and i to Brn3bAP/+ RGCs; and type m to Brn3cAP/+ RGCs. Types a–e are observed among both Brn3aAP/+ and Brn3bAP/+ RGCs; type n in Brn3aAP/+ and Brn3cAP/+ RGCs; and type o in all three Brn3AP/+ RGCs. The specific examples shown are derived from Brn3aCKOAP/+ (a, b, e, j, k, l, n), Brn3bCKOAP/+ (c, d, f, g, h, i, o) and Brn3cCKOAP/+ (m) retinas. (D) Examples of RGC morphologies observed in the Brn3aCKOAP/− and Brn3bCKOAP/− retinas are enclosed in green and red outlines, respectively. Examples of bistratified Brn3aAP/− RGCs (p, q, r), bistratified Brn3bAP/− RGCs (s, w, x) and monostratified Brn3bAP/− RGCs (t, u, v) are shown. Scale bars in B, C and D, 100 µm.

