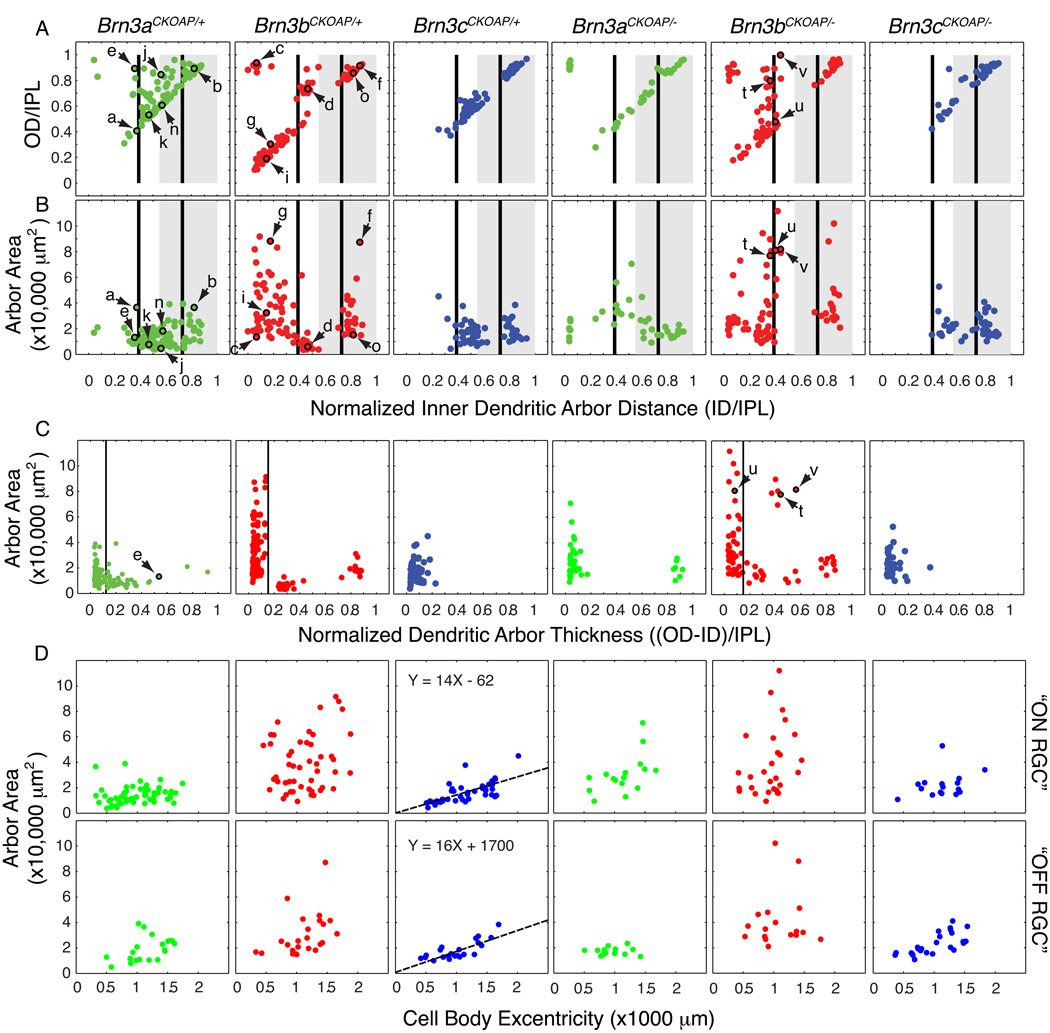
Fig. 3. Morphological parameters for monostratified Brn3AP/+ and Brn3AP/− RGCs.
Scatter plots in each vertical column refer to RGCs with the genotypes indicated at the top. Arrows and lower case letters identify the cells shown in Fig. 2. (A,B) Scatter plots of normalized inner distance (ID/IPL) vs. normalized outer distance (OD/IPL) and ID/IPL vs. dendritic arbor area. These parameters are defined in Fig. 1 H and I. The black vertical bars at 0.39 and 0.73 ID/IPL (referred to in the text as ~0.4 and ~0.7, respectively) represent the stratification levels of the “ON” (0.39) and “OFF” (0.73) bands of calretinin, calbindin, and choline acetyltransferase immunostaining, as measured by Haverkamp and Wassle (2000), Morgan et al. (2006), and Badea et al. (2009a). The grey rectangle spanning 0.55–1.0 ID/IPL represents the “OFF” sublamina of the IPL, as determined by the stratification level of the central band of calretinin/calbindin immunoreactivity (Haverkamp and Wassle, 2000; Badea et al 2009a) and of the axon arbor terminals of mGluR6-expressing, “ON” bipolar cells (Morgan et al 2006). (C) Scatter plots for the dendritic arbor thickness, (OD-ID)/IPL vs. arbor area. The dendritic arbor thickness represents the difference of the outer distance (OD) and inner distance (ID), as defined in Fig. 1H, normalized to the thickness of the IPL. (D) Dendritic arbor areas increase with eccentricity for flat monostratified Brn3cAP/+ and Brn3cAP/− RGCs in the mouse retina. Scatter plots of eccentricity (distance of the cell body from the optic nerve head) vs. area for flat monostratified RGCs. Flat monostratified RGCs include all monostratified Brn3cAP/+ RGCs, as well as Brn3aAP/+ and Brn3bAP/+ RGCs with normalized dendritic arbor thicknesses <0.12 and <0.15, respectively; these cutoffs are based on the positions of troughs in the arbor thickness distributions in panel C. For Brn3aAP/+ and Brn3bAP/+ RGCs, “ON” or “OFF” types were defined as having an ID/IPL ratio under or above 0.55, respectively. For Brn3cAP/+ RGCs, cells close to the 0.55 ON/OFF border were grouped with the RGCs that clustered nearby in parameter space in panels A and B. There is a linear correlation between eccentricity and dendritic arbor area for both “ON” and “OFF” Brn3cAP/+ and Brn3cAP/− RGCs, and the best fitting straight line is shown.

