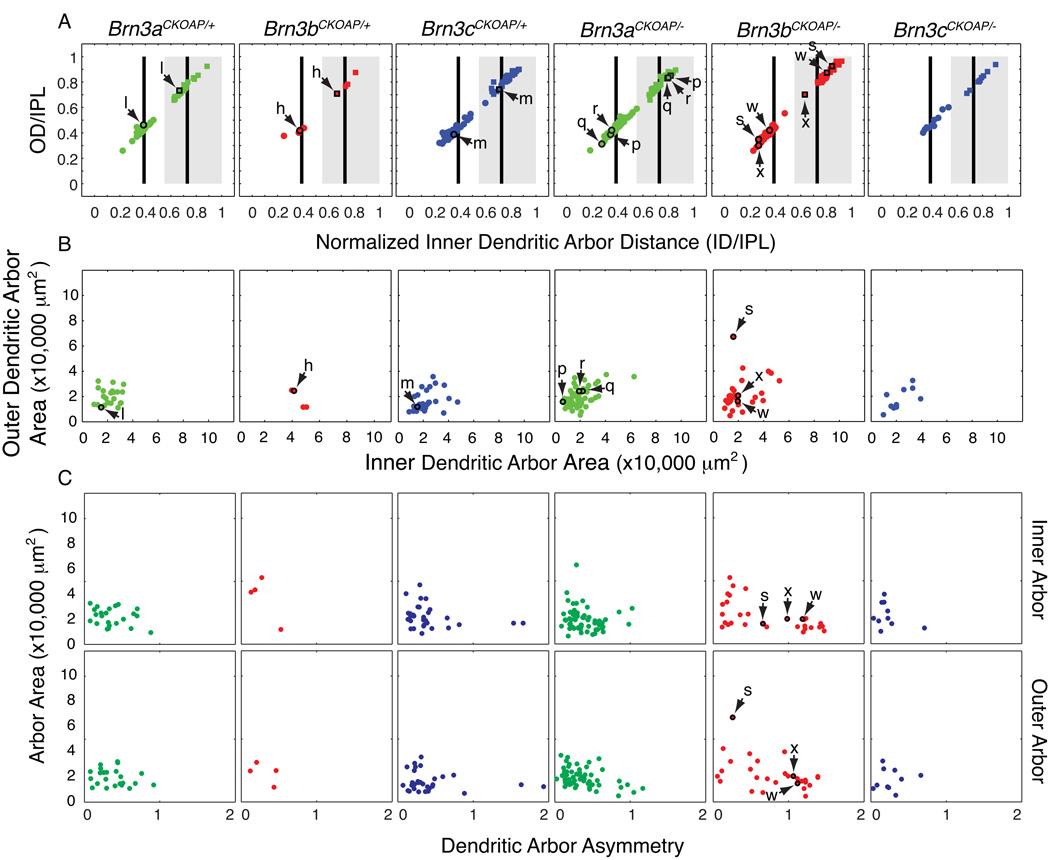
Fig. 4. Morphological parameters for bistratified Brn3AP/+ and Brn3AP/− RGCs.
Scatter plots in each vertical column refer to RGCs with the genotypes indicated at the top. Arrows and lower case letters identify the cells shown in Fig. 2. (A,B) Scatter plots of normalized inner distance (ID/IPL) vs. normalized outer distance (OD/IPL) and inner dendritic arbor area vs. outer dendritic arbor area. These parameters are defined in Fig. 1 H and I. For black vertical bars and gray rectangle landmarks in panel A, see Fig. 3 legend. In (A) stratification parameters for the inner dendritic arbors (circles) and outer dendritic arbors (squares) are plotted for each cell, e.g. inner and outer dendritic arbors for cell l, in the Brn3aCKOAP/+ scatter plot are plotted as a circle and a square, highlighted by a black outline, and indicated by a pair of arrows. (C) Scatter plots of dendritic arbor asymmetry vs. arbor area, for inner (top) and outer (bottom) arbors. The asymmetry parameter is defined as the distance from the xy coordinates of the cell body to the center of mass of the bounding polygon of the dendritic arbor, normalized by the average radius of the bounding polygon.

