
Figure 11.
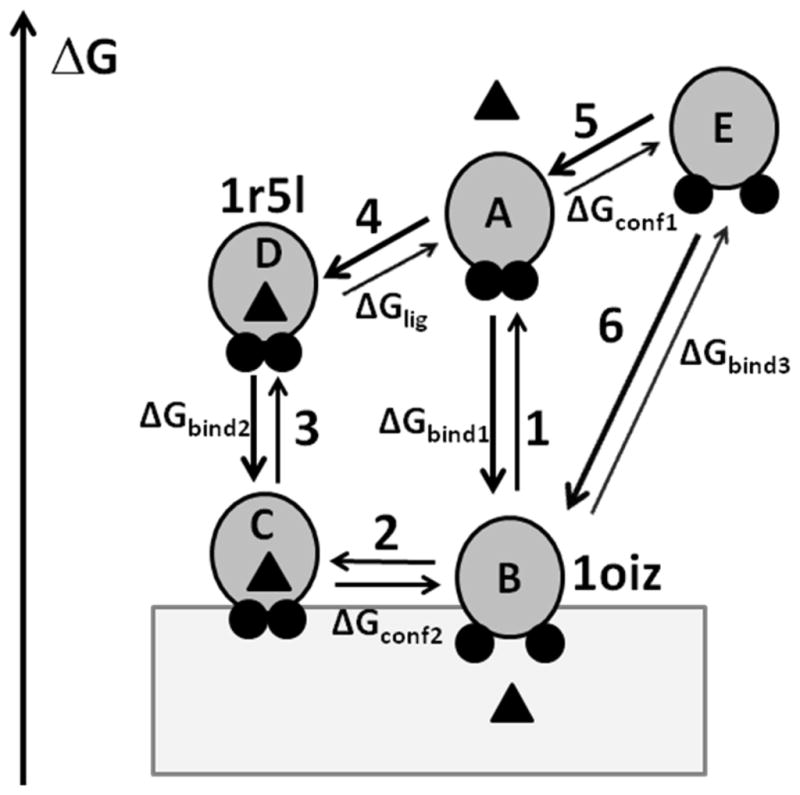
Transitions between different states of α-TTP. α-TTP is shown by gray circles with A8 and A10 helices shown by small black circles, α-tocopharol is shown by a triangle, bilayer is shown by a grey rectangle. α-TTP can adopt a “closed” or an “open” conformations in water and in the membrane-bound state. Two lid helices are tightly packed in the “closed” conformation, but move apart in the “open” conformation. Left axis shows relative free energy of different states. In the aqueous solution, the ligand-bond closed conformation (D) has a lower energy than ligand-free open conformation (E) because of the increased exposure of non-polar residues to water during the opening of the structure and ligand dissociation. However, the corresponding conformations C and B are expected to have similar energies in membrane because the nonpolar residues remain buried in the lipid environment. Note, that the energy gain for membrane binding of ligand-free state (transition 1, ΔGbind1) is larger than for ligand-loaded state (transition 3, ΔGbind2). Calculations of transfer energy with PPM 2.0 for 1r5l and 1oiz structures provide estimations of ΔGbind1 (transition 3) and ΔGbind3 (transition 6), respectively.