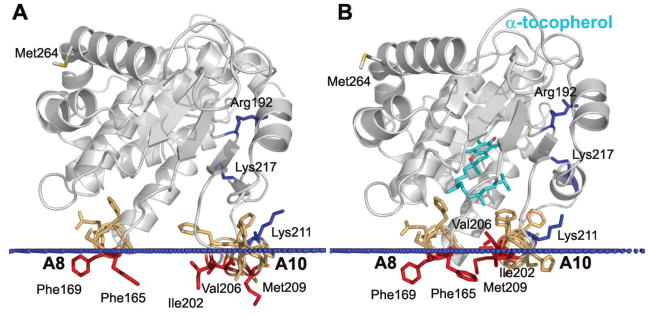
Figure 3.
Comparison of the predicted association between the “open” (A) and “closed” (B) conformations of the α-TTP and the lipid bilayer. “Open” and “closed” conformations correspond to 1oiz and 1r5l PDB entries, respectively. Cartoon representations of α-TTP structures are colored grey. αTocopherol (cyan), mutated residues (red for hydrophobic and blue for basic), and residues from “gating” helices A8 and A10 (orange) are shown by sticks. Calculated membrane boundaries are shown by blue dots.

