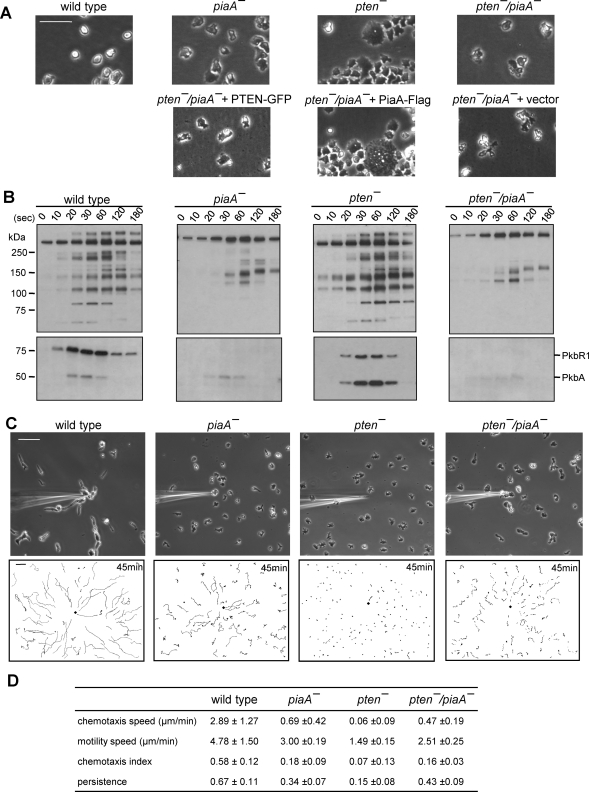
FIGURE 2:
Disruption of PiaA rescues defects in pten- cells. (A) Upper panels show representative images of wild-type, piaA-, pten-, and pten-/piaA- cells growing on glass substrates. Lower panels show pten-/piaA- cells carrying PTEN-GFP, PiaA-Flag, or empty vector. Bar, 50 μm. (B) Phosphorylation of PKB substrates and of activation loops in PKBR1 and PKBA. Cells were stimulated with 1 μM cAMP and analyzed with Western blot using antibodies against phosphospecific PKB substrates (upper panels) and phospho PKC (lower panels). (C) Chemotaxis assays. Cells were observed for 45 min at 30-s intervals. Upper panels show images at 45 min after chemotaxis was initiated. In lower panels, trajectories of the entire chemotaxis field are shown. The black diamond indicates the location of micropipette tip. Bar, 50 μm. (D) Quantification of the chemotaxis movies. Average and standard deviation of at least three movies for each cell line are calculated. See Materials and Methods for the definitions of these parameters.

