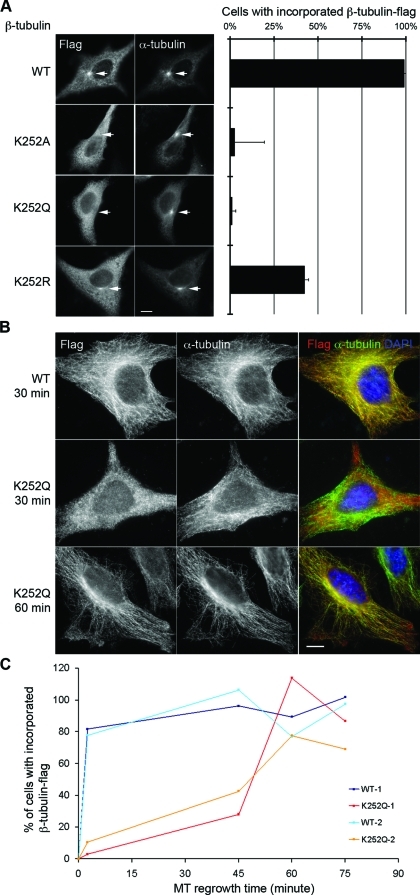
FIGURE 7:
Incorporation of the acetylation-mimicking β-tubulin mutants is delayed in the MT regrowth assay. (A) HeLa cells expressing indicated tubulin mutants were subjected to MT regrowth assay, fixed after 2.5 min of regrowth, and stained for tubulin mutants (flag) and MTs (α-tubulin). Representative images are shown. Arrows mark centrosomal MT asters. Scale bar, 10 μm. Right panel shows the quantification of flag-stained cells with flag-positive centrosomal MT asters. In each sample, at least 50 cells were counted, and the average percentage was determined from three independent experiments. Error bars indicate standard deviation. Between wild type and all three mutants, p < 0.001. (B) The K252Q mutant-expressing cells after 30 and 60 min of regrowth were stained for tubulin mutants (flag, red), MTσ (α-tubulin, green), and DNA (DAPI, blue). Representative images are shown. Scale bar, 10 μm. (C) Quantification of cells with incorporated β-tubulin-flag after extraction. For each data point, at least 150 cells were counted, and the percentage of cells with flag staining was normalized to the percentage of flag-stained cells without extraction. Data from two independent experiments are shown.

