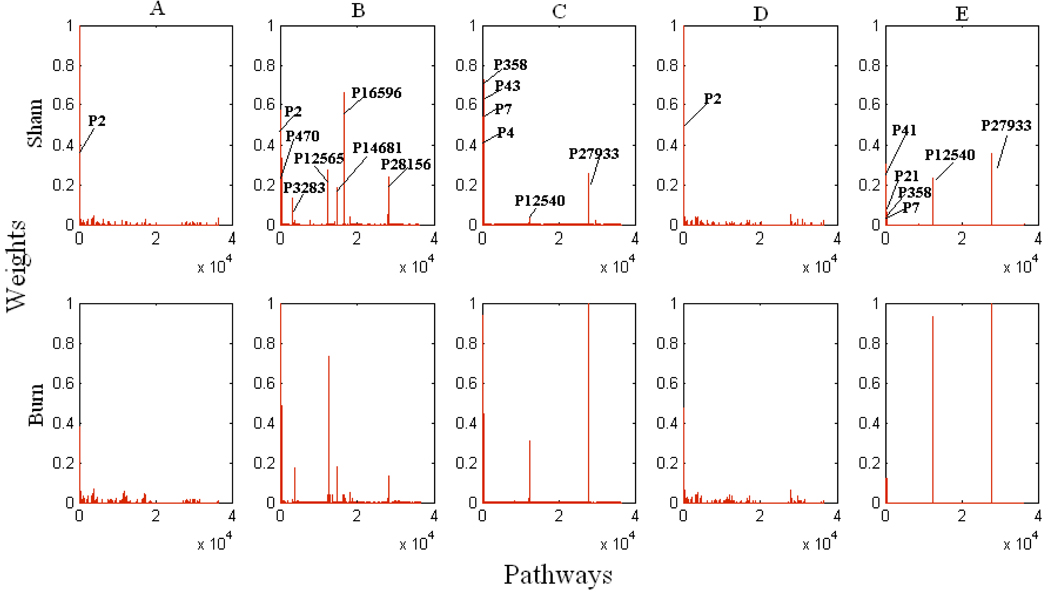
Figure 2. Weight values of pathways.
Panels in the first row represent the sham data, and the second row the burn data. Panels in each column indicates different method: A) Minimizing the length of weight vector, B) Maximizing the entropy, C) Maximizing the number of pathways, D) Maximizing the activity of shortest pathways, E) Maximizing the activity of pathways including glucose and /or urea production. Weights of some pathways, P 358, P43, P7, and P4, which are not clear on the panels of column C, are respectively 0.72, 0.34, 0.02, and 0.01 after sham treatment, and 0.44, 0.93, 0.45, and 0.02 after the burn treatment. Weights of P41, P21, P358, and P7 on the panels of column E are respectively 0.30, 0.08, 0.12, and 0.001 after sham treatment, and 0.05, 0.12, 0.06, and 0.06 after burn treatment. Note that in each method all weights values are normalized according to largest one observed among the sham and burn results.

