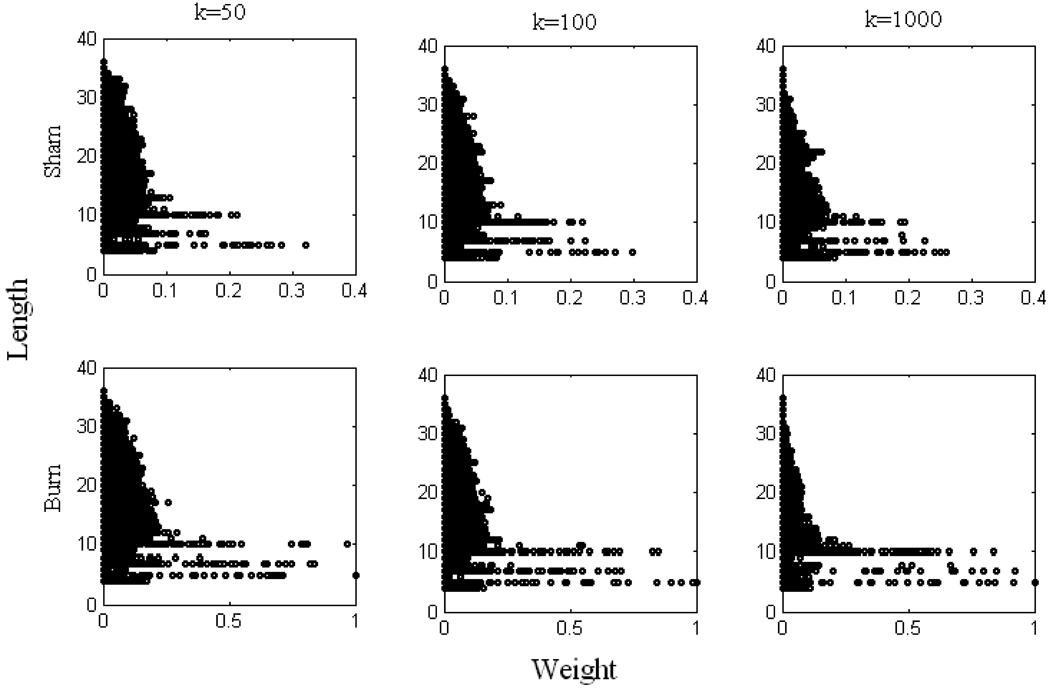
Figure 6. The relation between weight value and pathway length obtained from problem (13).
Panels in each column represent different k. Panels in the first row correspond to sham data, and the second row burn data. Note that at different k, all weights values are normalized according to largest one observed among the sham and burn results.

