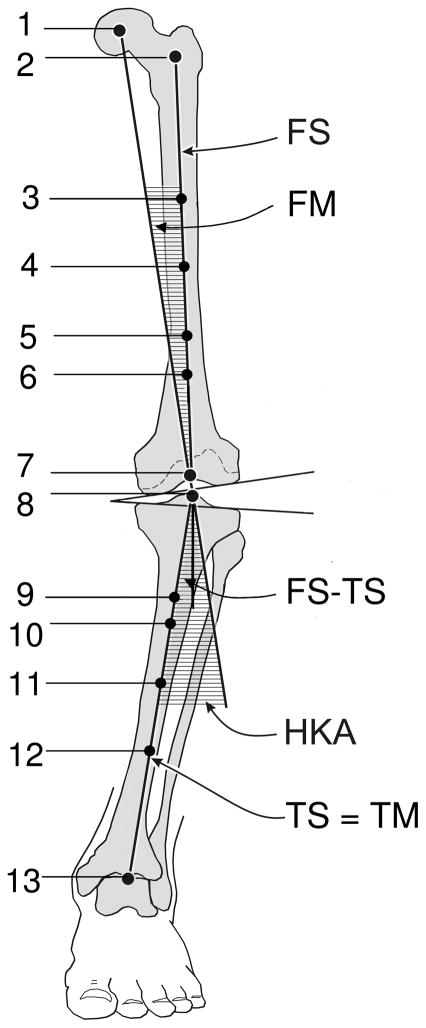
Figure 1.
Diagram of a full-length lower limb radiograph with a varus alignment. Mechanical and anatomic axes as well as the various angles are represented. The points marked on the radiograph in order to calculate the hip-knee-ankle angle (HKA) and the various femoral shaft-tibial shaft angles (FS-TS) are numbered 1 to 13. 1 – centre of head of femur, 2 – femoral intertrochanteric point, 3 – ⅔ femoral shaft point, 4 – ½ femoral shaft point, 5 – ⅓ femoral shaft point, 6 – 10 cm femoral shaft point, 7 – femoral intercondylar point, 8 – tibial interspinous point, 9 – 10 cm tibial shaft point, 10 – ⅓ tibial shaft point, 11 – ½ tibial shaft point, 12 – ⅔ tibial shaft point, 13 – tibial mid-plafond point. FS – femoral shaft (femoral anatomic axis), FM – femoral mechanical axis, TS – tibial shaft (tibial anatomic axis), TM – tibial mechanical axis, HKA – hip-knee-ankle angle, FS-TS – femoral shaft-tibial shaft angle.
Modified from Cooke et al. J Rheumatol 2007;34:1796–1801, with permission.

