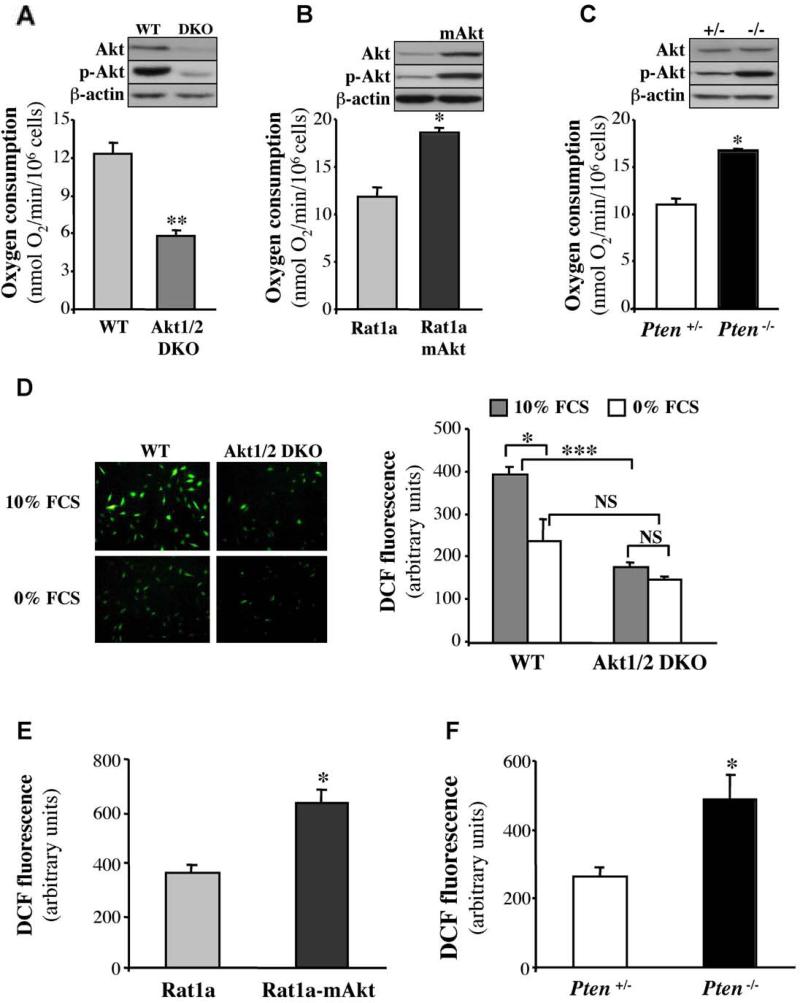
Figure 2. Akt regulates oxygen consumption and ROS generation.
A-C. Rates of oxygen consumption in WT or Akt1/2 DKO MEFs (A), Rat1a, or Rat1a expressing activated Akt (Rat1a mAkt) (B), and Pten+/- or Pten-/- MEFs (C) were measured as described in Experimental Procedures. Immunoblots show the relative level of phosphorylated Akt (p-Akt Ser 473) and total Akt in all cell lines. Data represent the mean ± S.E.M. of at least three independent experiments. *, ** p<0.05, 0.01 vs. WT (A), Rat1a (B) and PTEN+/- (C). D-F. Akt mediates the generation of ROS. D. Levels of ROS in WT and Akt1/2 DKO MEFs incubated in 10% FBS or in 0% FBS overnight. Left panels: representative images of cells stained with DCF. Right panel: quantification of ROS levels. *, P < 0.05; ***, P < 0.001; NS, not significant. E. Levels of ROS in Rat1a and Rat1a-mAkt cells. F. Level of ROS in Pten+/- and Pten-/- MEFs. Data are expressed as arbitrary units after being normalized to protein concentration. All data represent the mean ± S.E.M. of at least three independent experiments. *, p<0.05 vs. Rat1a (E) or Pten+/- (F).

