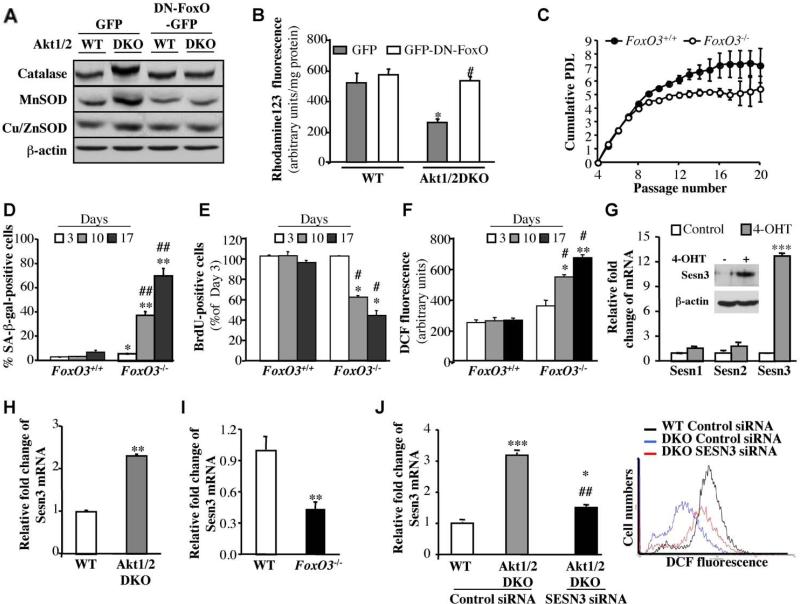
Figure 3. FoxO transcription factors regulate the generation of ROS and replicative senescence downstream of Akt.
A. Catalase and MnSOD are upregulated in Akt1/2 DKO MEFs, and are downregulated by DN-FoxO. The generation of cells expressing DN-FOXO is described in Experimental Procedures. Proteins extracted from exponentially growing DNp53-immortalized WT and Akt1/2 DKO MEFs overexpressing GFP (control vector) or DN-FOXO-GFP were subjected to immunoblotting using antibodies specific for catalase, MnSOD, Cu/ZnSOD and β actin as a loading control. B. DN-FOXO restores intracellular level of ROS in Akt1/2 DKO cells. Quantification of ROS in WT and Akt1/2 DKO MEFs overexpressing GFP or DN-FOXO-GFP after incubation of cells with rhodamine123 as a sensor of ROS production (described in Experimental Procedures). Data represent the mean ± S.E.M. of three independent experiments. *, p<0.05 vs. GFP-WT. #, p<0.05 vs. GFPAkt1/2 DKO. C. Wild-type (FOXO3+/+) and FOXO3 null (FOXO3-/-) primary MEFs were analyzed for replicative senescence using the 3T3 protocol. Cumulative PDL is plotted against Passage Number. Data represent the mean ± S.E.M. of three independent experiments. D. SA-β-gal activity in primary FOXO3+/+ and FOXO3-/- cells. Assay was performed at 3, 10 and 17 days in culture. *, **, p<0.05, 0.01 vs. FOXO3+/+, ##, p<0.01 vs. Day 3. E. Cell proliferation was assessed by BrdU incorporation at the same time points shown in (D). *, p<0.05 vs. FOXO3+/+, #, p<0.05 vs. Day 3. Data represent the mean ± S.E.M. of three independent experiments. F. Level of ROS in primary FOXO3+/+ and FOXO3-/- cells at the same time points as in (D). Data are presented as arbitrary units after being normalized to protein concentration. *, **, p<0.05, 0.01 vs. FOXO3+/+, #, p<0.05 vs. Day 3. Data represent the mean ± S.E.M. of at least three independent experiments. G. Left panel. Level of Sestrin 1, 2 and 3 mRNA as determined by quantitative RT-PCR. Wild type MEFs immortalized with DN-p53 and stably expressing FoxO1AAA-ER were treated with 4-OHT followed by RNA analysis as described in Experimental Procedures. ***, p<0.001 vs. control. Right panel. Immunoblot showing induction of Sesn3 protein level after FoxO1AAA-ER activation by 4-OHT. H. Level of Sestrin 3 mRNA in WT and Akt1/2 DKO MEFs, immortalized with DN-p53, as assessed by quantitative RT-PCR. **, p<0.01 vs. WT. I. Level of Sestrin 3 mRNA in WT and FOXO3-/- MEFs immortalized with DN-p53. All RNA analyses were done in triplicates. **, p<0.001 vs. WT. J. The knockdown of Sesn3 in Akt1/2 DKO MEFs elevates ROS levels to that in WT cells. Left panel: Levels of Sesn3 mRNA in WT, Akt1/2 DKO and Akt1/2 DKO-Sesn3 KD MEFs as assessed by quantitative RT-PCR. *, ***, p<0.05, 0.001 vs. control siRNA in WT and ##, p<0.01 vs. control siRNA in Akt1/2 DKO. Data represent the mean ± S.E.M. of three independent experiments. Right panel: Levels of ROS in WT, Akt1/2 DKO and Akt1/2 DKO-SESN3 KD MEFs as assessed by DCF fluorescence.

