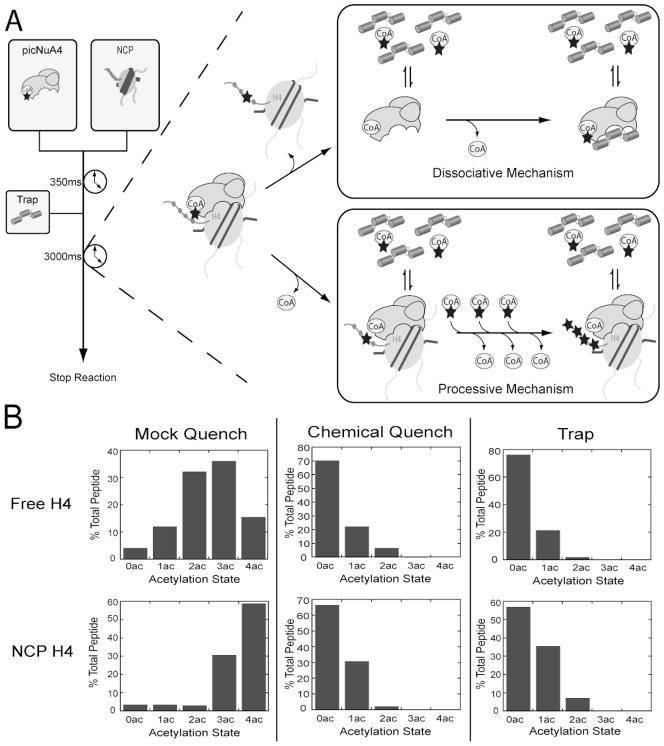
Figure 2. Substrate trapping indicates picNuA4 dissociates after each acetylation event.
Substrate trapping methodology allows for the determination of the total number of acetylations taken place per binding event. A) Rapid quench flow was used to rapidly mix pre-equilibrated picNuA4 and AcCoA with H4 or nucleosomal substrate. Reactions were carried out for 350 ms and quenched with buffer (50 mM Tris, pH 7.5), 2 % (v/v) TFA, or competitive inhibitor trap (200 μM gH4, ~100x excess Ki). Reaction conditions: 1 μM picNuA4, 40 μM AcCoA, 8 μM H4 (or 4 μM NCP), 50mM Tris (pH 7.5) and 1 mM DTT. B) Graphs depict percent of total peptide per acetylation state as determined from MS analyses of rapid quench flow samples. MS results were analyzed with Thermo Bioworks and filtered with peptide probability < 0.01, Xcorr vs. charge +1 ≥ 2.0, +2 ≥ 2.7, +3 ≥ 3.5 and with ΔCn ≥ 0.2. Data sets are representative of n = 2 for both H4 and NCP experiments. Substrate trapping MS experimental replicates differed no more than 5% (H4) and 7% (NCP) per acetylation state.

