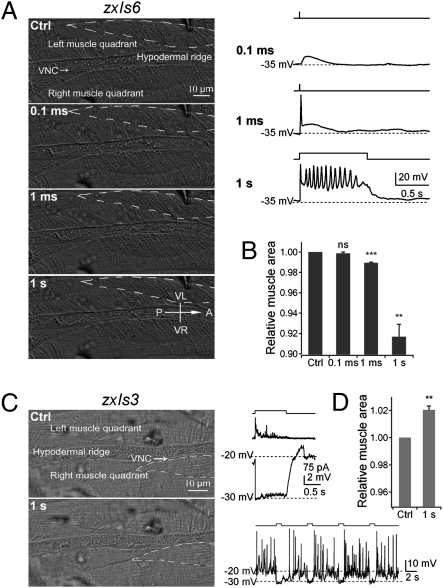
Fig. 5.
Action potentials drive body wall muscle contractions. (A Left) Representative muscle morphology before and after 0.1-ms, 1-ms, and 1-s light stimulation. VNC, ventral neural cord. (Right) The membrane potential in response to light stimulation in the same muscle. (B) Normalized muscle surface cell areas outlined by dashed lines in A. (C) In zxIs3 animals, GABAergic motoneurons hyperpolarize and drive relaxation. (Left) Representative muscle morphologies before and after 1-s light stimulation. (Right) Changes in membrane potential of body muscle cells during light stimulation. Four consecutive 1-s light stimulations induced muscle hyperpolarization and completely inhibited spontaneous action potential firing (Lower Right). (D) This inhibition correlated with muscle relaxation, shown by increased cell areas (n = 4). ns, not significant; **P < 0.01; ***P < 0.001; t test against control. (Error bars: SEM.)

