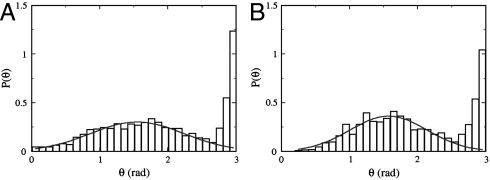
Fig. 2.
Flicking angle θ distribution in a homogeneous medium (A) and in a sharp chemical gradient created by a point source of attractant (1 mM serine) (B). The distribution in both cases contains two peaks, a broad one at θ ≈ π/2 and a narrow one at π. The solid lines in the figure are fittings using a Gaussian function.

