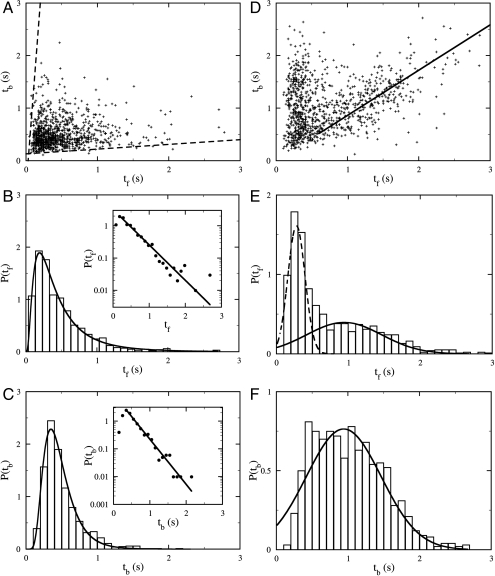
Fig. 3.
Statistical distribution of tf and tb in a homogeneous motility buffer (A–C) and near a sharp serine gradient (D–F). In A and D, pairs of consecutive forward tf and backward tb swimming intervals between two flicks are plotted with random shifts of less than 0.03 s to avoid data points overlapping. In the homogenous medium, there is no correlation between tf and tb, whereas in the attractant gradient there is a strong correlation between tf and tb. The biological cause of such a correlation is discussed in SI Results and Discussion. The solid line in D is a linear fit to the data points with large tf and has a slope of 0.86. The PDFs of tf and tb in the two cases are plotted in B and E and in C and F, respectively. The Insets in B and C are semilog plots of the same datasets as in the main figures. The solid lines are exponential fits to the tail parts of the data. The good agreement between the data and the fits shows that for large tf and tb the PDFs are exponential. The solid line in F is a Gaussian fit. The same fitting curve was rescaled and replotted in E as the solid line. The broken line in E is a Gaussian fit to the short-time peak of P(tf).

