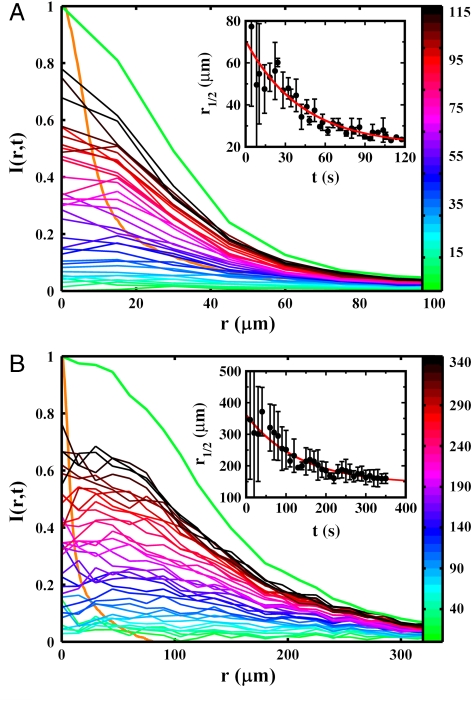
Fig. 5.
Normalized fluorescence intensity profiles I(r,t) for V. alginolyticus (A) and E. coli (B). The intensity profiles are proportional to the bacterial concentration profiles B(r,t). The individual runs are color coded according to the color bar (in seconds). Note the significantly different spatial and temporal scales used in these plots, indicating that the swarm size and the aggregation time are quite different between the two bacteria. As a comparison, the normalized steady-state bacterial and the serine profiles are displayed by the thick green and orange curves, respectively. The Insets represent the time-dependent half-height radii r1/2(t) of the corresponding bacterial profiles B(r,t). The red lines are exponential fits, which are described in the main text.

