
Figure 2.
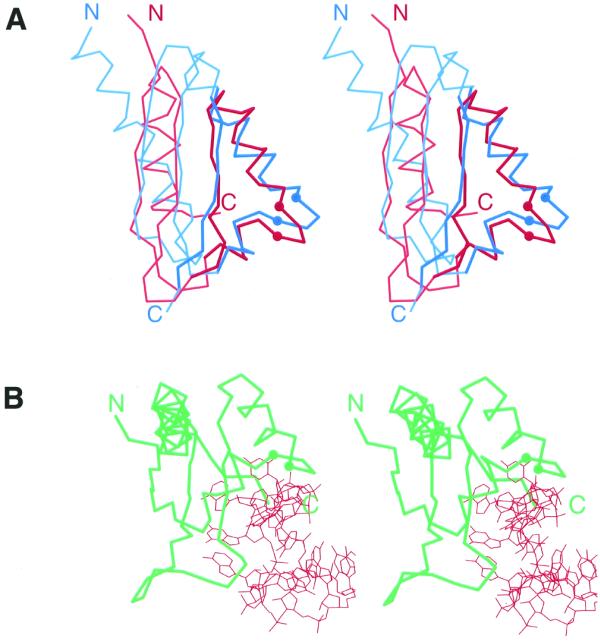
Stereo diagrams of KH domains. The Cα traces of proteins are shown and the Cα atoms of the two conserved glycines in KH motif signature region are displayed as balls. N- and C-termini are labeled. (A) Stereo diagram of superimposed Cα traces of type I (maxi) KH of vigilin (red, PDB entry 1VIH, residues 6–76) and type II (mini) KH of ribosomal protein S3 (blue, PDB entry 1FJF, residues C28–C108). Superposition was performed using Insight II package (MSI). The regions used in RMSD minimization are outlined in darker colors and thicker lines. The RMSD is 2.4 Å. (B) Stereo diagram of Nova-2 KH domain (green) bound to RNA (red), PDB entry 1EC6, residues A4–A90, RNA chain C.