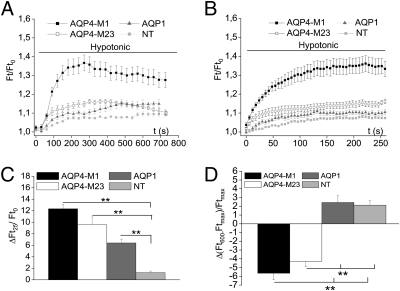
Fig. 6.
Transfection with M1 or M23 isoforms of AQP4 reconstitutes hypotonicity-induced RVD in DI TNC1 cells. (A) Calcein-quenching method for measurement of osmotically-induced volume changes in cells transfected with AQP4-M1 (black, n = 15), AQP4-M23 (white, n = 22), or AQP1 (gray, n = 17) and in nontransfected cells treated with Lipofectamine only (NT; light gray, n = 46). (B) Direct comparison of the initial phase (the first 200 s following exposure to hypotonic medium) of curves depicted in A. The initial swelling is significantly faster in all the transfected cells than in the nontransfected cells. (C) Quantitative analysis of data presented in A. Ordinate values represent mean rate of volume change at 25 s of hypotonic stress compared with baseline level. (P > 0.001; ANOVA and independent t-test, n as in A). No significant difference is detectable between cells transfected with AQP4-M1 (black; n = 15) and cells transfected with AQP4-M23 (white; n = 22; P = 0.135; independent t-test). **P ≤ 0.01. (D) Ordinate values represent mean volume change calculated as described in Materials and Methods. A decrease in regulatory volume, represented by negative values, is seen after transfection with AQP4 isoforms M1 (black bar) or M23 (white bar) but not after transfection with AQP1 cells (dark gray bar) or in nontransfected (NT) cells (light gray bar). P < 0.01; ANOVA and independent t-test. **P ≤ 0.01.

