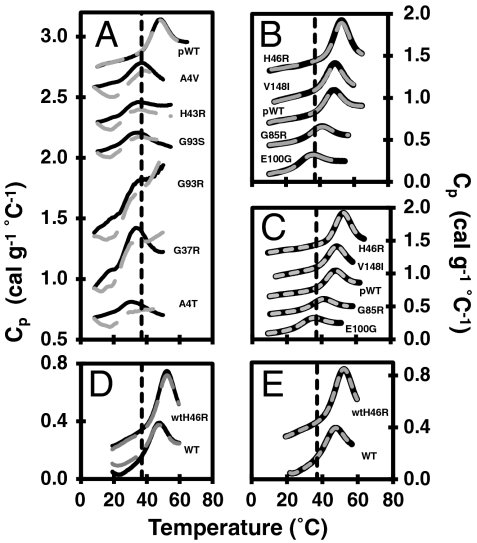
Fig. 2.
Reversibility and data fitting of reduced apo mutants. The dashed black line indicates physiological temperature. (A) Consecutive thermal unfolding endotherms of reduced apo mutants with low unfolding reversibility and (B) with high unfolding reversibility (scan 1—solid black line; rescan—large dashed gray line). (C) DSC data fitting of the reduced apo mutants and pWT. Typical thermograms (solid black lines) with corresponding two-state monomer fits (small dashed gray lines) are shown. (D) Consecutive thermal unfolding endotherms of WT and wtH46R (scan 1—solid black line; rescan—large dashed gray line). (E) DSC data fitting of WT and wtH46R SOD1. Thermograms (solid black lines) with corresponding two-state monomer fits (small dashed gray lines) are shown. In each panel, the datasets are offset for clarity.

