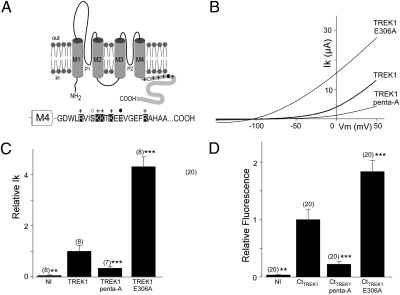
Fig. 2.
The current amplitude of TREK1 mutants are correlated with the membrane fluorescence of the corresponding EGFP-CtTREK1 mutants. (A) Membrane topology of TREK1. The sequence of the cytoplasmic C terminus of TREK1 starting at Gly293 is indicated. +, basic residues (R297, K301, K302, K304, and R311); open circles, PKC (S300) phosphorylation site; and dark circle, pH sensor site (E306). (B) Currents were elicited by voltage ramps (from −150 to +50 mV, 1 s in duration). (C) Normalized amplitude of noninjected oocytes (NI), TREK1-WT, TREK1-Penta-A, and TREK1-E306. (D) Normalized membrane fluorescence level of oocytes expressing EGFP-CtTREK1, EGFP-CtTREK1-penta-A, and EGFP-CtTREK1-E306A. Student's t test (**P < 0.01, ***P < 0.001) show the difference between TREK1 and TREK1 mutants (or EGFP-CtTREK1 and EGFP-CtTREK1 mutants). The numbers of cells tested are indicated in parentheses.

