Fig. 4.
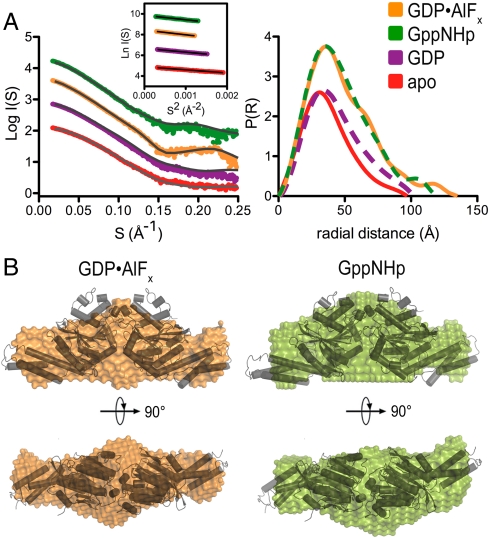
Small-angle X-ray scattering. (A) Solution scattering data for atlastin-1. Intensity plots and P(r) functions for apo (red), GDP-bound (purple), GppNHp-bound (green), and GDP•AlFx-bound (orange) atlastin-1 (residues 1–446) are shown. (Left, Inset) Corresponding Guinier plots. (B) SAXS-based shape reconstructions for nucleotide-bound solution states of atlastin-1. The dimeric form 2 crystal structure was docked in the models as a reference and is shown as a cartoon presentation.

