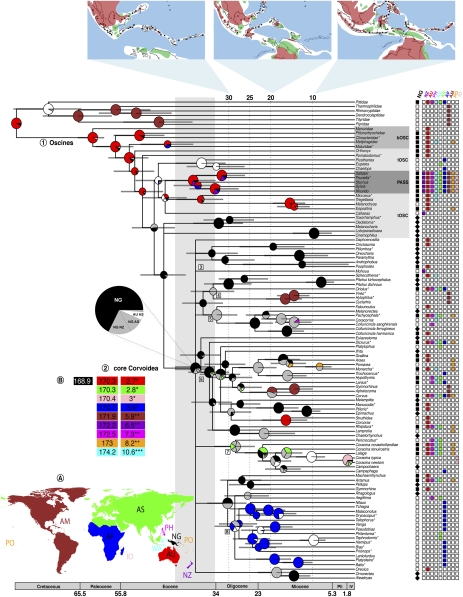
Fig. 1.
Chronogram and ancestral areas for oscine passerine birds. A summary of the Bayesian dispersal-vicariance analysis for oscine passerine birds. The tree is a chronogram based on a 50% majority-rule consensus tree of a Bayesian analysis of a combined data set of nuclear introns (ODC and Myo2), nuclear exons (RAG-1 and RAG-2), and mitochondrial (ND2) DNA sequences. The distribution for each taxon, as delimited in the map (A), is presented in the columns to the right of the taxon names (bOSC, basal oscines; tOSC, transitional oscines; PASS, Passerida). For New Guinea, a diamond indicates that the taxon is endemic. Pie charts at internal nodes represent the marginal probabilities for each alternative ancestral area derived by using dispersal-vicariance analysis (DIVA) and integrating over tree topologies using MCMC. These probabilities account for the phylogenetic uncertainty in the rest of the tree and the biogeographic uncertainty at each node, conditional on this node to occur. The colors of the pie charts reflect the probability of the area of origin according to the geographical delimitations in A. Gray and light gray colors indicate multiple areas of origin shared with New Guinea. White indicates multiple areas of origin not shared with New Guinea. All other colors indicate only one area of origin. Large pies indicate well-supported nodes (PP ≥ 0.95 and ML bootstrap ≥ 70). Nodes discussed in the text are indicated with numbers before the node. Taxa for which two different species from the same genus were used in the analyses are indicated with an asterisk after the genus name. (A) Biogeographic regions: AF, Africa; AM, America; AS, Asia; AU, Australia; IO, Indian Ocean islands; NG, New Guinea; NZ, New Zealand; PH, Philippines; WA, Wallacea; PO, Pacific Ocean islands. The inset maps above, of the transition zone between Southeast Asia and Australia (after refs. 22 and 23), show the distribution of land and see from the Oligocene to the present at 10-million y intervals: red, land; blue, deep sea; white, shallow sea; green, calcareous plateaus, which may at times have been above sea-level. Triangles represent volcanism and emergence of oceanic islands. (B) Summary of the BayesTraits analysis. The left column indicates the harmonic mean, ordered with the highest at the top. New Guinea (black) is the most likely area of origin with the highest harmonic mean. The right column indicates the Bayes factor compared against New Guinea as the favored area of origin. * Indicates positive evidence and ** indicates strong evidence for the favored hypothesis.

