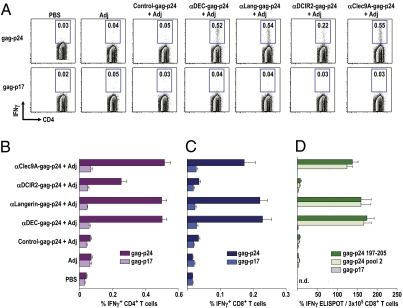
Fig. 2.
α-Langerin, α-DEC205, and α-Clec9A induce comparable Th1 and CD8+ T-cell responses in C×B6 F1 mice. (A) C×B6 F1 mice were immunized with 5 μg of α-receptor fusion mAbs in the presence of 50 μg of poly IC and 25 μg of α-CD40 [adjuvant (Adj)]. Fourteen days later, splenocytes were restimulated in vitro with HIV gag-p24 or HIV gag-p17 (negative control) peptide mix in the presence of Brefeldin A for 6 h. Intracellular staining was performed to detect IFN-γ in CD3+CD4+ T cells. (B) As in A, but % of IFN-γ+ CD4+ T cells is shown as mean ± SD of four to six experiments with two to three mice per group. (C) As in A, but this time, the % of IFN-γ+ CD8+ T cells is shown as mean ± SD of four to six experiments with two to three mice per group. (D) As in A, but after 14 d, purified splenic CD8+ T cells were restimulated with CD11c+ bead-purified DCs and CD8 nanomer (gag-p24 197-205), p24 reactive pool 2, or p17 nonreactive peptide mix. IFN-γ production was evaluated by ELISPOT. Data are representative of three to four similar experiments with three mice pooled in each experiment. n.d., not determined.

