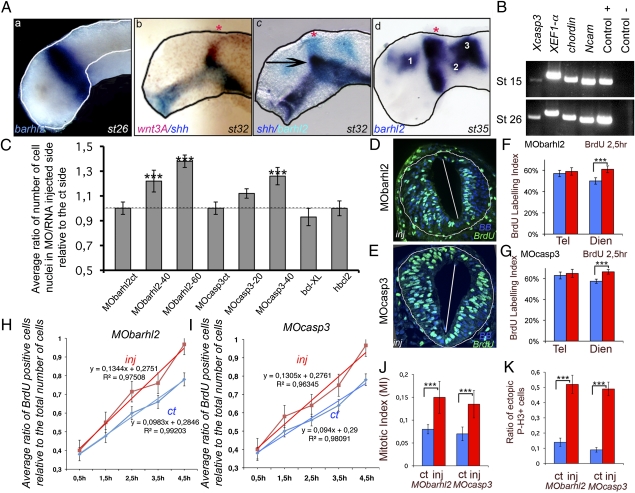
Fig. 1.
Barhl2 or Casp3 depletion influence on neural tube hyperplasia, cell-cycle length, and neuroepithelium architecture. (A) barhl2 is expressed in the prosomere P2. ISH or double ISH on dissected neural tubes. (a) At st 26, barhl2 is expressed at the epichordal–prechordal border in the alar and basal plates of the neural tube. (b) At st 31 and 32, barhl2 expression overlaps with that of wnt3A (compare b and c). (c) The barhl2 rostral border of expression coincides with the rostral border of the ZLI (black arrow). (d) At st 33, barhl2 is expressed in the prospective diencephalon in the prospective pallium (1), the medial part of the pretectum (2), and the dorsal mesencephalon and future cerebellum (3). The pineal gland is indicated with a red star. (B) casp3 is expressed in the neural plate (st 15) and neural tube (st 26). RT-PCR analysis. chordin and Ncam are mesodermal and neuroectodermal markers, respectively. XEF-1α and the plasmid encoding Casp3 were used as positive controls, and water was the negative ct. (C) Average ratio of the number of nuclei on the MO/RNA-injected side of the neural tube relative to that on the ct side. Embryos were injected with MObarhl2, MOcasp3, bcl-XL, or hbcl2 cRNA. The dotted line indicates a ratio of 1. MObarhl2ct (n = 3); MObarhl2-40 (40 ng; n = 6); MObarhl3-60 (60 ng; n = 7); MOcasp3ct (n = 3); MOcasp3-20 (20 ng; n = 5); MOcasp3-40 (40 ng; n = 8); bcl-XL (n = 5); hbcl2 (n = 4). The differences in Rinj/ct between MObarhl2ct and MObarhl2-60 (P ≤ 0.033), MObarhl2ct and MObarhl2-40 (P ≤ 0.06), and MOcasp3ct and MOcasp-40 (P ≤ 0.036) are significant. (D–G) BrdU labeling index (LI). (D and E) Representative st 26 diencephalic sections immunostained for BrdU (green) merged with bisbenzimide (BB; blue). BrdU LI was measured in st 26 forebrain neuroepithelium in (F) Barhl2- and (G) Casp3-depleted sections. (F) MObarhl2-injected embryos: telencephalon (ct vs. inj; n = 5, P ≤ 0.41) and diencephalon (ct vs. inj; n = 9, P ≤ 0.0001). (G) MOcasp3-injected embryos: telencephalon (ct vs. inj; n = 5, P ≤ 0.141) and diencephalon (ct vs. inj; n = 9, P ≤ 0.0001). ct, ct side; inj, injected side. (H and I) BrdU cumulative analysis. In st 26 diencephalic neuroepithelium, the cumulative BrdU incorporation rate measured as the slope of the linear regression function is higher in the injected side (red) vs. the ct side (blue) of (H) MObarhl2-injected (0.130 vs. 0.094; n ≥ 4 for each time point) or (I) MOcasp3-injected (0.1344 vs. 0.098; n ≥ 4 for each time point) embryos. H, hours. The average cell-cycle length, as described by Tc value, decreases in both MObarhl2- (Tc = 6.9 ± 0.64 h) and MOcasp3-injected (Tc = 7.1 ± 0.64 h) cells compared with noninjected cells (Tc = 8.7 ± 0.65 h and Tc = 8.9 ± 0.65 h), respectively. The changes in Tc observed among different types of cells are not affected by Ts, the duration of the S phase, which is always evaluated at 1.54 ± 0.28 h. (J) Mitotic index. MObarhl2 (ct vs. inj; n = 8, P ≤ 0.008) and MOcasp3 (ct vs. inj; n = 8, P ≤ 0.001). (K) Ratio of ectopic mitotic figures. Ratio of P-3H–positive cells outside the ependymal zone (at least two cellular diameters) relative to the total number of mitotic cells. MObarhl2 (n = 8, P ≤ 0.0001) and MOcasp3 (n = 7, P ≤ 0.0001).

