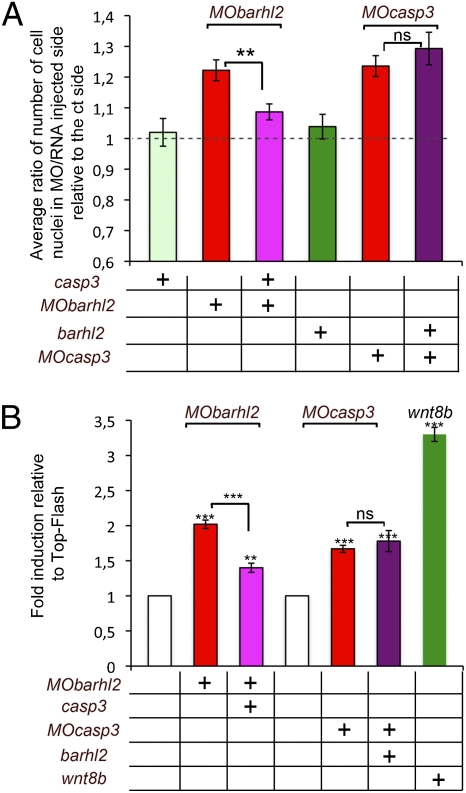
Fig. 4.
Casp3 acts downstream of Barhl2 in limiting Wnt pathway activation. (A) Diencephalic enlargement complementation. Embryos were injected with MObarhl2-40, MOcasp3-40, casp3, or barhl2 cRNA as indicated. Rinj/ct is shown. The dotted line indicates a ratio of 1. n, number of sections analyzed. MObarhl2-40 (n = 41); MOcasp3-40 (n = 28); casp3 (n = 31); barhl2 (n = 26); MObarhl2-40 together with casp3 (n = 41); MOcasp3-40 together with barhl2 (n = 41). The differences in Rinj/ct between MObarhl2-40 and MObarhl2-40/casp3 are significant (P ≤ 0.016); the difference between MOcasp3-40 and MOcasp3-40/barhl2 is not (P ≤ 0.416). (B) TOP-Flash induction complementation. Fold induction relative to TOP-Flash is shown. n, number of AC analyzed. TOP-Flash (n = 75), MObarhl2-40 (n = 48); MObarhl2-40 with casp3 (n = 54); MOcasp3-40 (n = 42); MOcasp3-40 with barhl2 (n = 42); wnt8b (n = 18). The differences in relative activity between respective controls and MObarhl2-40 (P ≤ 0.001), MObarhl2-40/casp3 (P ≤ 0.015), MOcasp3-40 (P ≤ 0.006), MOcasp3-40/barhl2 (P ≤ 0.037), wnt8b (P ≤ 0.002), and MObarhl2-40 and MObarhl2-40/casp3 (P ≤ 0.001) are all significant in contrast to the difference in fold activity between MOcasp3-40 and MOcasp3-40/barhl2 (P ≤ 0.656). Ns, not significant.

