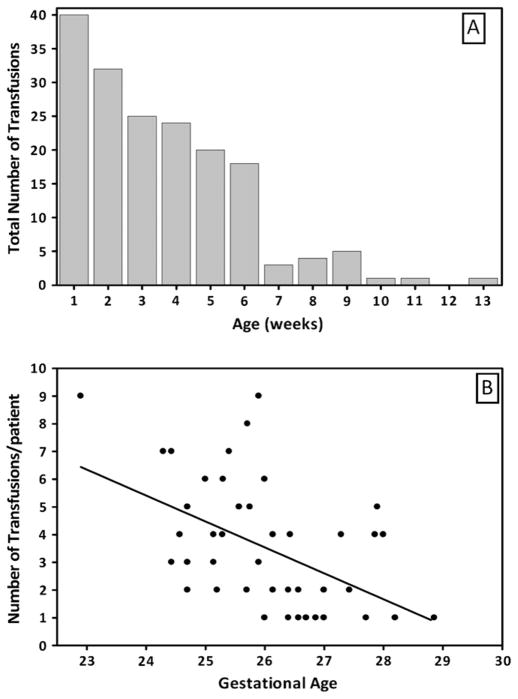
Figure 1.
Distribution of PRBC transfusions by weeks of life and corrected GA. The histogram shows that PRBC transfusions are inversely correlated with GA and occur most frequently in the first 6 weeks of life. A, The Y axis shows the total number of transfusions; the X axis shows the week of life. B, transfusions per patient (Y axis) are shown as a function of gestational age (X axis).

