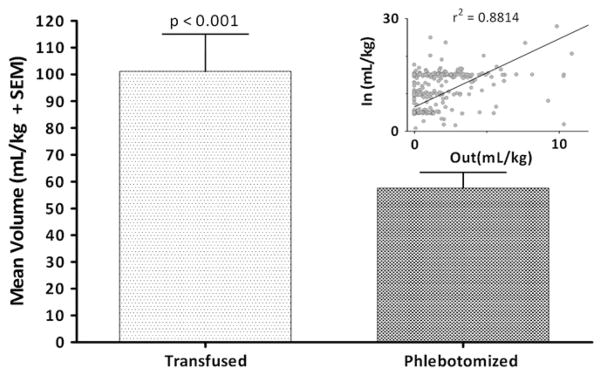
Figure 2.
Volume of PRBCs transfused and phlebotomized. The bar graph shows the mean (+ SEM) values for transfused and phlebotomized blood volumes per kg of birth weight. The scatter-plot compares the volumes and the Goodness of Fit value and regression line. Volume of blood transfused per kg of infant weight is 2 times higher than volume of blood phlebotomized (Non-parametric sign test, P < .0001).

