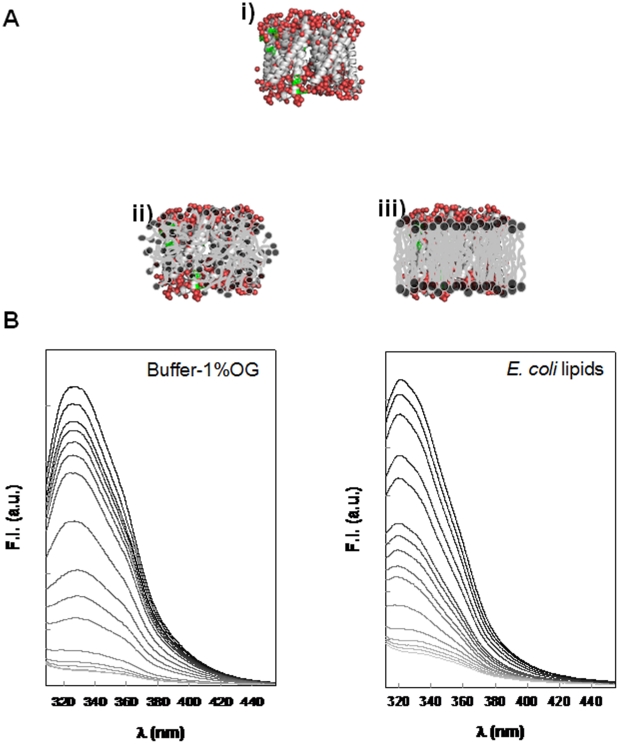
Figure 5. Fluorescence spectroscopy analysis of the protein ternary structure behavior.
A) Cartoons illustrating the Trp residues (green) position in the protein ternary structure SoPIP2;1. The structure derives from the PDB file 1Z98 [22] using VMD software is shown in i [50], an illustration of the protein position in detergent micelles in ii and in lipid bilayers in iii. B) Thermal unfolding of SoPIP2;1 monitored by tryptophan fluorescence. To the left, the protein is reconstituted into OG micelles and to the right the protein is reconstituted into E. coli lipid membranes. Temperatures are represented by the grayscale colors from black, 20°C to very light gray, 95°C.

