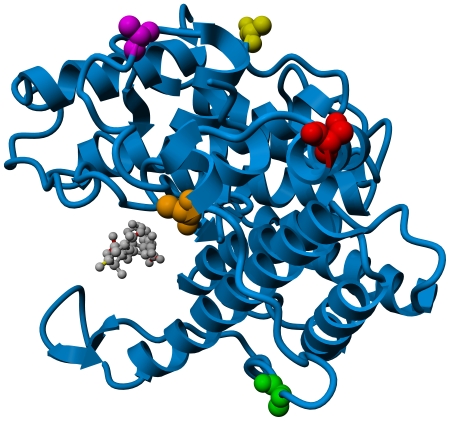
Figure 1. Sites of cysteine substitution.
Ribbon diagram of alginate Lyase A1-III (PDB file 1HV6). A trisaccharide reaction product is bound in the active cleft and shown as a grey ball and stick model. Amino acid residues targeted for cysteine substitution are shown in space filling mode, and are color coded as follows: S32C = Red, A41C = Orange, A53C = Green, A270C = Yellow, and A328C = Purple.

