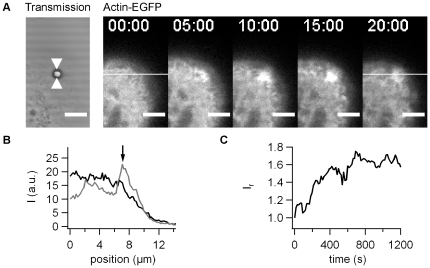
Figure 2. Dynamics of actin-EGFP accumulation with pilus coated beads.
A) One confocal plane of actin-EGFP producing epithelial cells was monitored during 20 min. Scale bar 5 µm. B) Intensity plot through the ROI shown in A) at black: 0 min, grey: 20 min post adhesion. C) Ir as a function of time for the time lapse in A).

