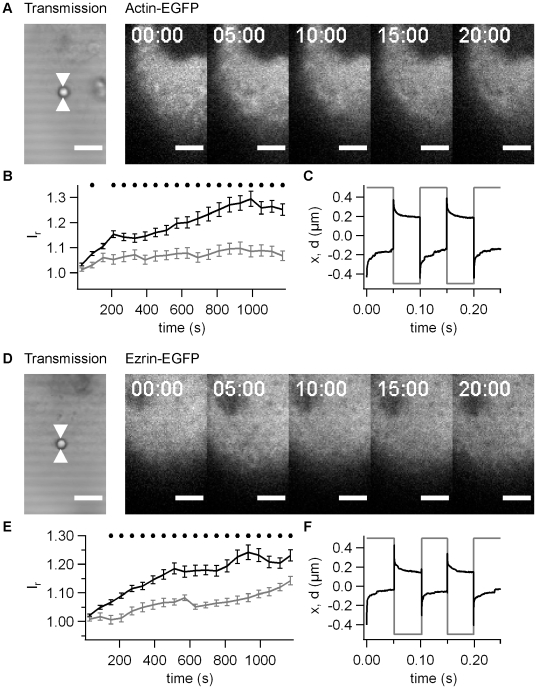
Figure 5. Accumulation of actin-EGFP and ezrin-EGFP depends on T4P.
A) Typical time lapse for actin-EGFP for beads coated with pilE- preparation (no pili). B) Relative fluorescence intensity Ir as a function of time for actin-EGFP averaged over 15 beads. Black line: T4P preparation from N400 wt pili, grey line: T4P preparation from pilE- strain. C) Grey line: The laser focus was moved by x = ±0.5 µm with respect to the initial position with a frequency of 10 Hz. Black line: Typical signal of the quadrant photodiode showing the position d. D) Typical time lapse for ezrin-EGFP for beads coated with pilE- preparation. E) Relative fluorescence intensity Ir as a function of time for ezrin-EGFP averaged over 15 beads. Black line: T4P preparation from N400 wt pili, grey line: T4P preparation from pilE- strain. F) Grey line: The laser focus was moved by x = ±0.5 µm with respect to the initial position with a frequency of 10 Hz. Black line: Typical signal of the quadrant photodiode showing the position d. B,D) Black dots mark statistical significant different values with pili and without pili (t-Test significance level p<0.01).

