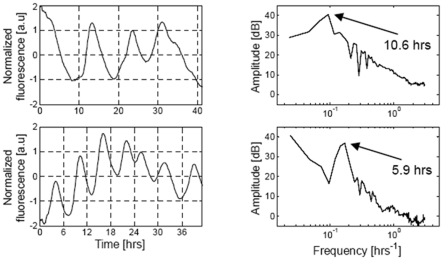
Figure 1. Experimental data from (Geva-Zatorsky et al., 2006, Fig.S3) [11].
Power spectrum of nuclear Mdm2-YFP fluorescence dynamics in individual cells. Top: an example of a cell showing fluctuations with a characteristic frequency of ∼10 hours (exposed to 0.3Gy of gamma irradiation), and the power spectrum of the signal (by Fourier transform). Bottom: an example of a cell with multiple oscillations with a period of ∼6 hours (exposed to 5Gy), and the power spectrum of the signal (right). Reprinted by permission from Macmillan Publishers Ltd: Molecular Systems Biology, advance online publication, 2006 (doi: 10.1038/msb4100068).

