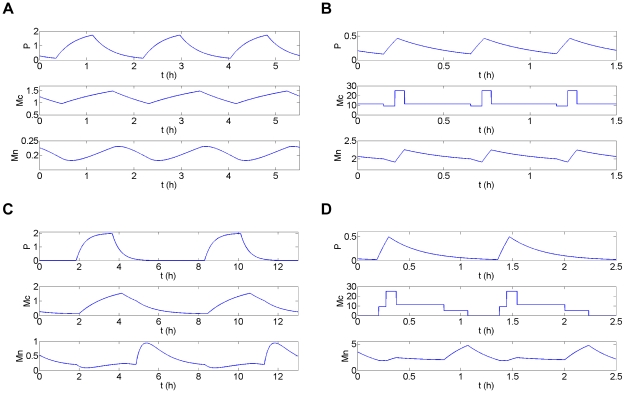
Figure 8. Temporal simulations for Model 2 and Model 3.
Temporal simulation (h) of the concentration (in nM) of p53 (P), cytoplasmic Mdm2 (Mc) and nuclear Mdm2 (Mn) for Model 2 (A and C) and Model 3 (B and D) in the small amplitude short period (A and B) and the large amplitude long period (C and D) oscillatory regime. For Model 3, Mc has been set as a constant Mcij in each domain Dij of the phase space following constraint (2) (see text). The parameter values are indicated in Figure 6 for Model 2 and in Figure 9 for Model 3.

