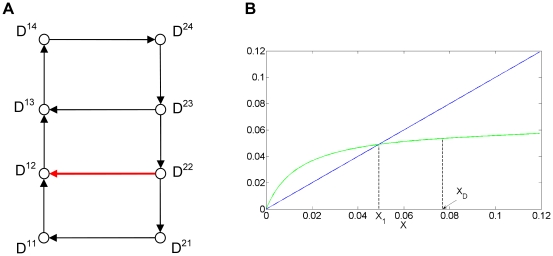
Figure 11. Transition graph and first return map for the modified Model 3.
(A) Transition graph of the modified model 3. (B) Graph of the corresponding first return map (in green) from and to the [0, x) axis (see Figure 10). The parameter values are indicated in Figure 9, except Mc22 = 1. The focal point of D22 is now in D11 inducing the additional transition from D22 to D12 (arrow in red). The fixed points of the first return function correspond to limit cycles of the system. The system presents a unique limit cycle (x = x1∼0.048) corresponding to the small amplitude oscillatory regime (see Figure 10C and 10D). The first return map shows a non smooth point at xD∼0.077 (see Text S6).

