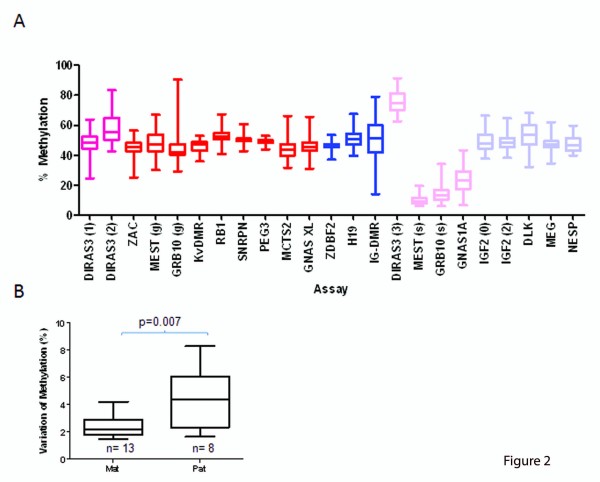
Figure 2.
Analysis of 23 differentially methylated region (DMR) assays in 50 individual blood samples. (a) Average methylation levels of 50 different individuals. Red = maternal germ-line DMRs; pink = maternal somatic DMRs; dark blue = paternal germ-line DMRs; light blue = paternal somatic DMRs. Box plots show the median, inter-quartile range and maximum/minimum methylation B standard deviation of all C-phosphate guanines (CpGs) assayed for maternal and paternal DMRs. A significant difference was observed between the intra-assay variability reported (matched pair t-test, P = 0.007).

