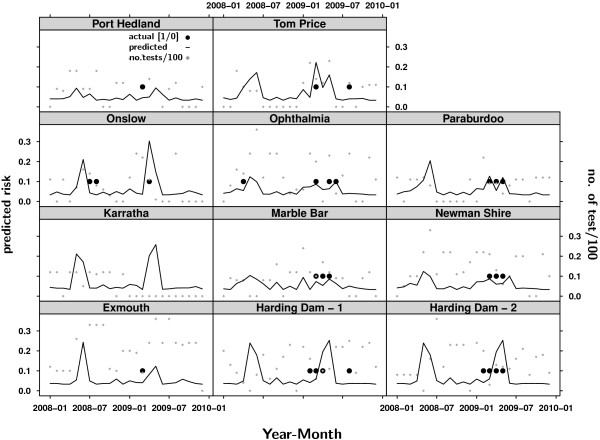
Figure 6.
MVEV status prediction for 2008 and 2009 in the Pilbara region. The monthly risk of testing positive to MVEV was predicted for each of the Pilbara sentinel chicken locations for 2008 and 2009 using the logistic regression model presented in Table 11. The presence of the black dots indicates that a location tested positive during a month, while the grey squares represent the monthly number of tests. There were very few seroconversions detected in the Pilbara in 2008, which were insufficiently predicted by the model. However the number of samples varied dramatically and there is the possibility of the virus being present according to the modelled risk without being detected. MVEV activity during 2009 was accurately predicted for most sample sites.

